Introduction to Grafana | Build your own Grafana dashboard and interface with reTerminal
Visualizing data is indeed a very useful and meaningful thing, and choosing a good tool for completing data visualization is also very important. Today I will introduce Grafana, an easy-to-use and adaptable data visualization tool. And recommended a best Raspberry Pi and screen integrated device compatible with Grafana. Hope it will help you to start using Grafana for data visualization.
Without further ado, let’s get started with the details of Grafana.

What is Grafana?
Grafana is a professional cross-platform open-source data visualization and metric analysis tool developed by Grafana Labs. Grafaba allows users to query, visualize, alert, and understand metrics from multiple data sources. No matter where the data is or what type of database, Grafana can be perfectly matched.
How does Grafana work?
Let’s briefly understand the typical structure of Grafana infrastructure. You can better understand how Grafana works by explaining this part of the infrastructure.
The Grafana infrastructure can be divided into three parts: data producer, data source, and Grafana dashboard.
The data producer generates the data that needs to be visualized, which may come from the integrated server Jenkin, virtual machine, Raspberry Pi, or sensors in various application scenarios. The data source is a database that aggregates data produced by data producers. The data source may come from Prometheus, AWS, Influx DB, etc., and the database is connected to the data producer. Depending on the type of database, the data source pulls data from the data producer, or the data producer is configured to push data to the database. The data actually visualized depends on the data source. Grafana is the front end to actually visualize the data, to get the data, Grafana queries the data source and the data source returns the requested data according to the query, and then this data is displayed on the Grafana dashboard.
What can be done using Grafana?
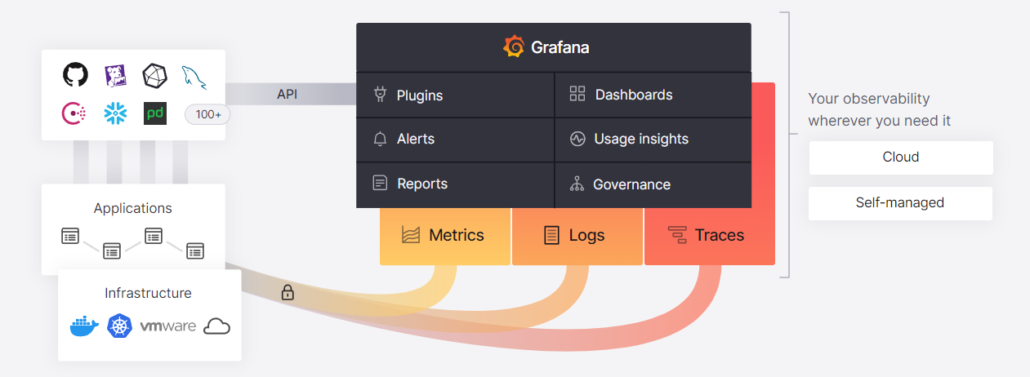
As the picture above shows, Grafana can render external data source data via API plugins, a process that does not require data migration or ingestion.
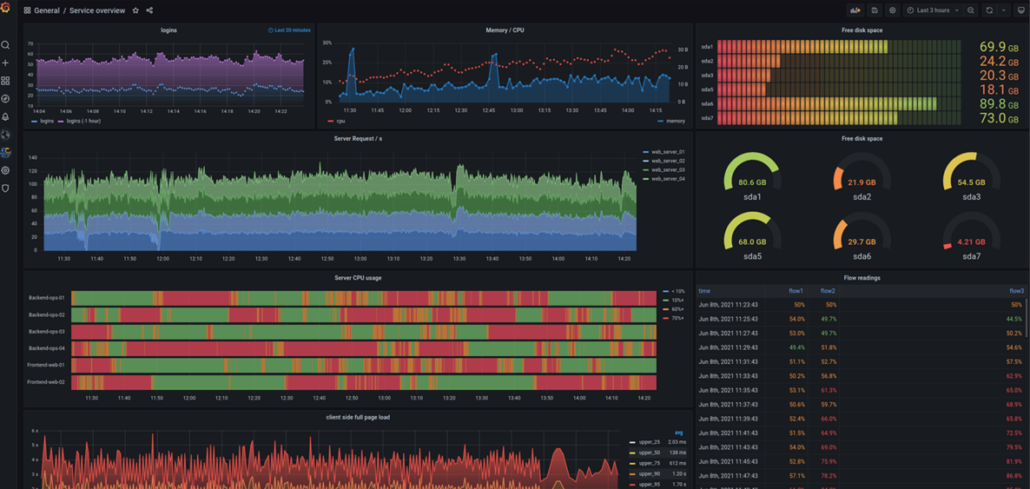
-Data visualization. You can visualize your data using the appropriate ones in a variety of dynamic Grafana dashboards. It features fast and flexible client-side graphics that make data presentations clear and beautiful.
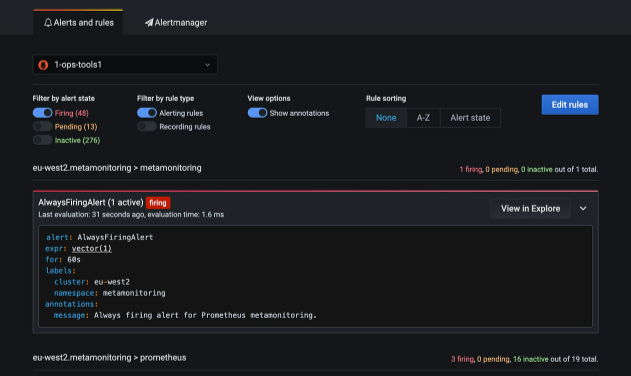
-Data Alerts & Notifications. You can create and manage data anomalies in the Alerts and Rules section. When data alerts occur, Grafana will continuously monitor the assessment and issue notifications. This will more efficiently manage the items you monitor.
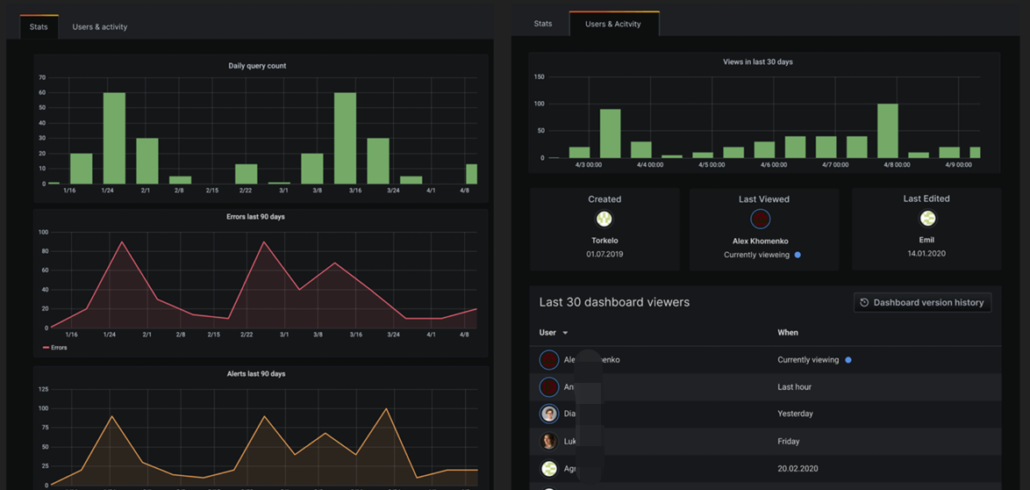
-Use insights. Data and dashboard information in Grafana can be shared among team members. Data begins to flow, and the value behind the data is constantly being mined driven by the data.
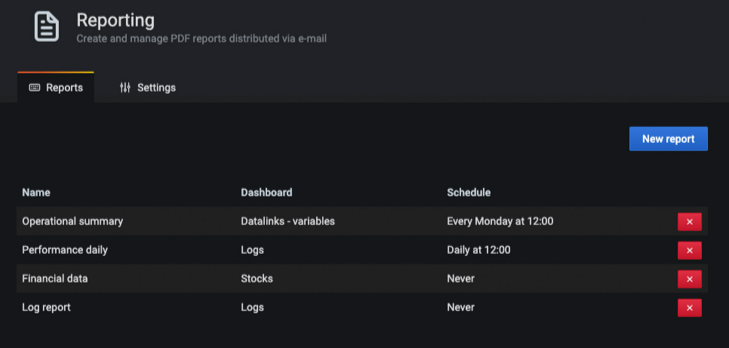
-PDF Reports Export & Transmission. The generated visualization data can be exported as a report in PDF format and can be sent to those who need it by Email.
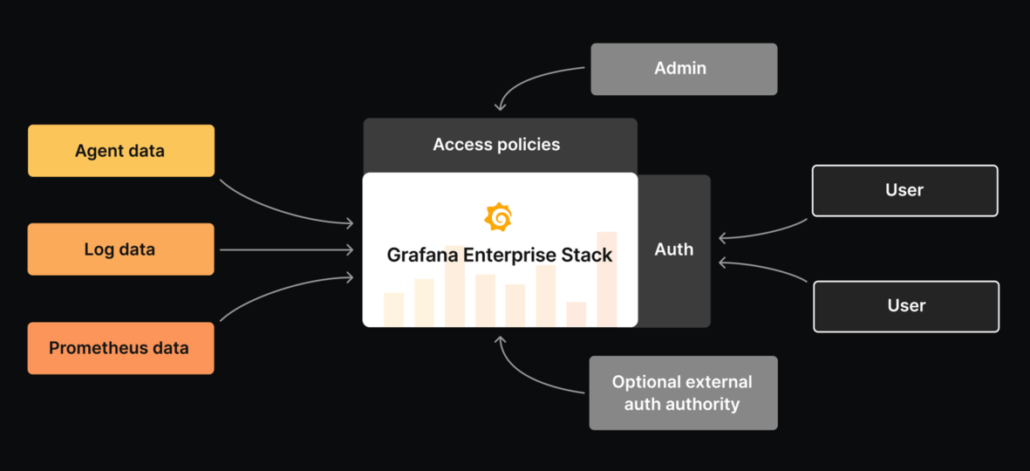
-Efficient governance. Use advanced data management tools to manage data from multiple data sources, making user permissions and data more clear and secure.
Why use Grafana?
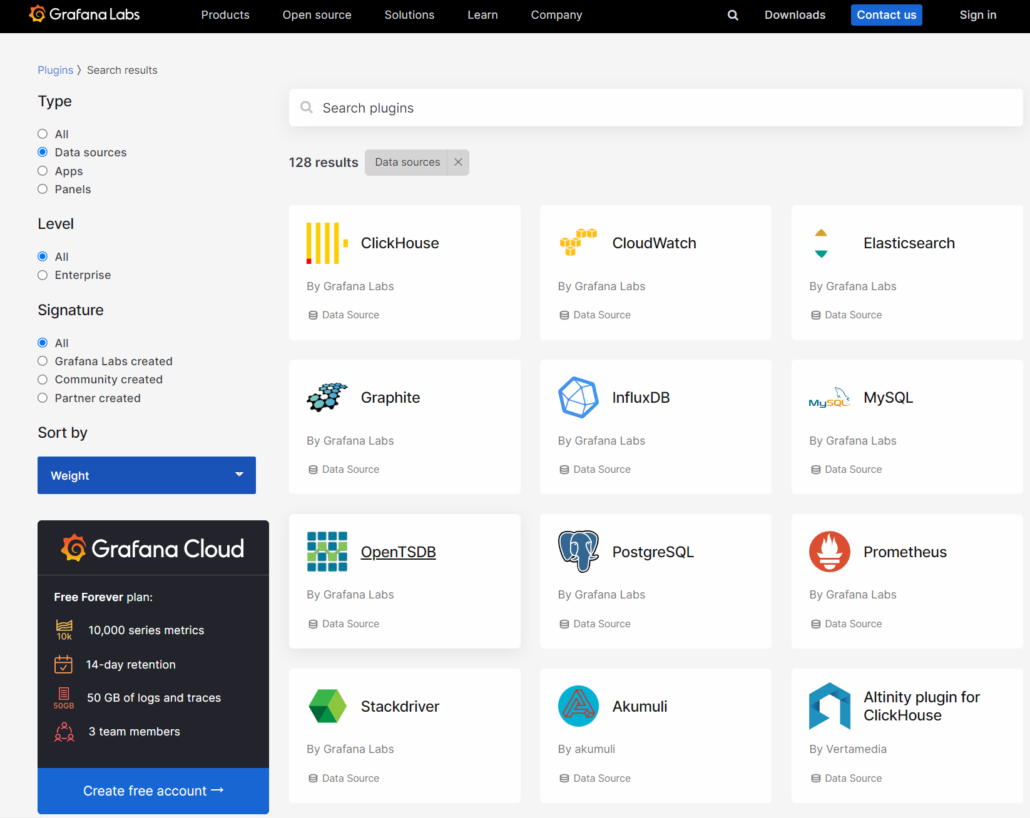
Grafana has a wide range of data visualization techniques, rich dashboard building, and a wide range of supported data source types. For example, commonly used database types AWS, Prometheus, Elasticsearch, Influx DB, MySQL, etc.
There are more than 100 data source plugins supported by Grafana, which can basically cover all types of data sources created. So it can be used as a general visualization tool.
Grafana supports a large number of visual charts, and various types of data visualization panel plug-ins are available. And if these cannot meet your needs, you can support secondary development to customize your own plug-ins.
Grafana is also user-friendly with rich documentation support.
How to manage Grafana?
Grafana Labs provides us with two directions:
1. Use Grafana Cloud to comprehensively manage data;
2. Self-management on user-owned infrastructure.

Grafana Cloud is an observation platform that integrates metrics, logs, and traces in Grafana. The benefit is that users can easily and quickly configure dashboards without the overhead of installing, maintaining, and expanding the observable stack. And you don’t have to worry about its availability and scalability at all, because it can automatically upgrade and security patches and backups, greatly reducing the need for operation and maintenance.
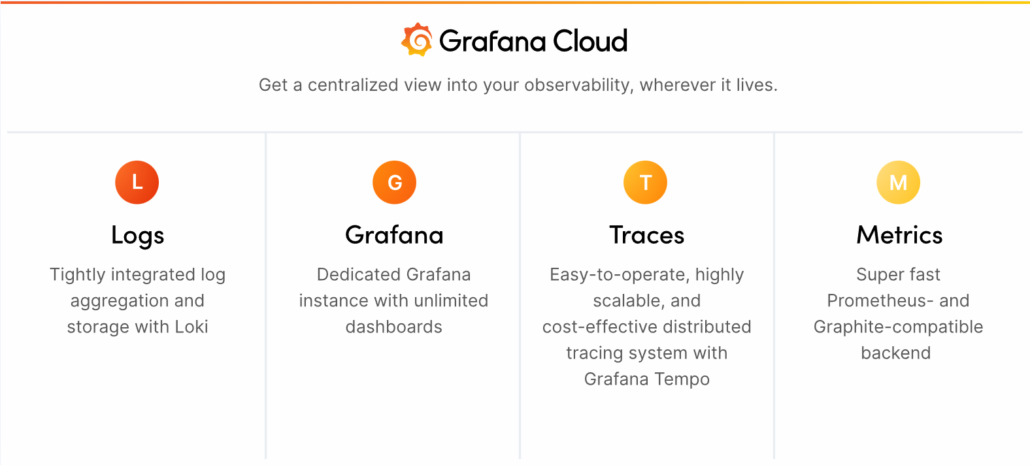
If your needs are clear and only detect metrics, logs, or traces, you can choose to self-manage the configuration. For the query, visualization, reminder, and other operations of indicators, Grafana can perfectly realize the functions. If you need to manage a large amount of log data, then Grafana Loki can be more suitable for your project. If it is a large amount of data to be tracked, a distributed tracking backend Grafana Tempo can realize open-source, large-scale, efficient, and easy-to-use extended tracking.
Visit the Grafana download page where you can get the full version of the software.
Grafana Application Example – Deploying Weather Dashboard on reTerminal
This application example uses InfluxDB and Grafana to build a weather station dashboard on reTerminal and gives a complete Grafana tutorial on the project.
There are mainly the following steps:
1. Create a Grafana dashboard
2. Use ESP32 to collect weather data and publish it to InfluxDB
3. Install and setup Grafana on reTerminal
The authors use ESP to collect temperature, humidity, and pressure readings, which are then published to a time-series database in InfluxDB. This data is uploaded to Grafana, and you can customize the data visualization dashboard and display it on reTerminal.
Check out the specifics on how the project works and the unboxing of reTerminal here.
High-performance Raspberry Pi CM4 tablet – reTerminal
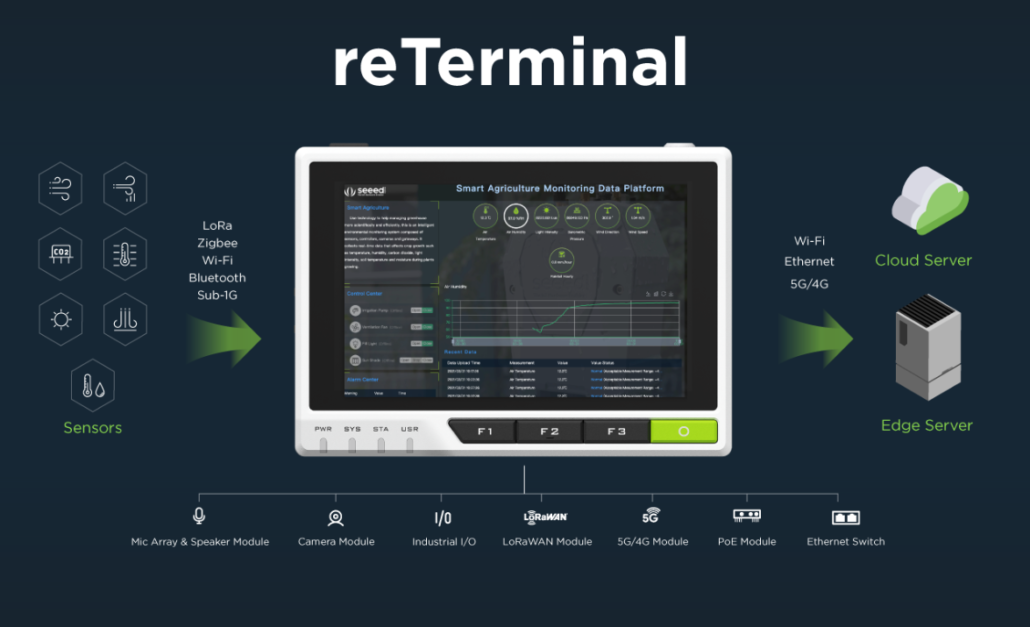
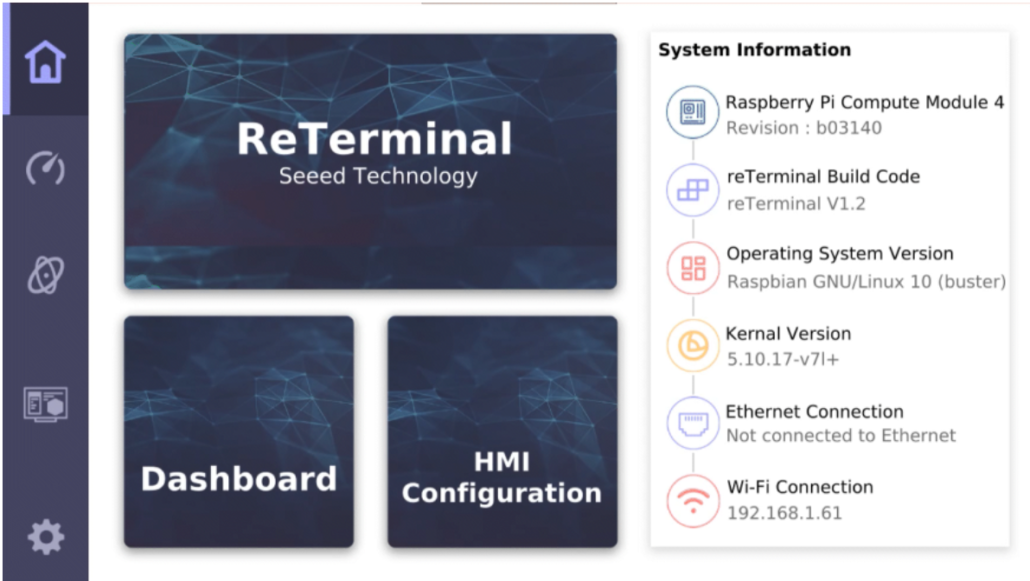
reTerminal is a powerful and excellent Human-Machine Interface (HMI) device powered by aRaspberry Pi Compute Module 4 (CM4) which is a Quad-Core Cortex-A72 CPU running at 1.5GHz and a 5-inch IPS capacitive multi-touch screen with a resolution of 720 x 1280 for convenient and powerful interactivity. It can easily and efficiently work with IoT and cloud systems to unlock endless scenarios at the edge.
Click on the reTerminal product details page for more details.
why reTerminal is the best hardware to go with Grafana?
- reTerminal is powered by raspberry pi cm4, with powerful performance, high stability and scalability.
- Wireless connectivity with dual-band 2.4GHz/5GHz Wi-Fi and Bluetooth 5.0 BLE makes more possibilities.
- Has a universal 40-pin GPIO header with the same pinout as other Raspberry Pi boards, ideal for connecting with sensors and expansion modules
- reTerminal is a Raspberry Pi with a screen all-in-one device, equipped with a large-screen 5-inch capacitive multi-touch screen.
These all make it ideal as a reliable and convenient data visualization device.
The touch display is really responsive and is quite accurate for its size. As I’ve mentioned in previous reviews, like my review of the RasPad 3, Raspberry Pi OS itself isn’t the greatest for use with a touch display as the icons land up being really small and quite difficult to touch accurately. But if you’ve going to build your own dashboards and interfaces, which is the point of the reTerminal, then you have the opportunity to make the icons a bit bigger and these should work well.
BY MICHAEL KLEMENTS: Grafana Weather Dashboard on the reTerminal by Seeed Studio
The above content is all about data visualization tools, platforms and usage, so why do we spend so much space on data visualization? Of course because data visualization is very important.
Why is data visualization so important?
Data is the premise of all analysis. And as most agree, “data is valuable”. It is very important to mine the meaning behind the data. For example, a large number of users subscribe to the arrival notification of a certain out-of-stock product, then we can initially analyze and judge that this product has a relatively large demand, and it is worth preparing to produce more of this product. There are too many cases like this, and we can manually analyze and judge some data.
Program Director, Marketing and Economics at American Public University
However, with the rapid development of the Internet and the advent of the era of big data, it is difficult to analyze and mine the vast amount of data only by manual labor. At this time, data visualization is an important medium, which allows data to be displayed in a clear and intuitive way. Data visualization can make the information of big data analysis more valuable and meaningful, which is conducive to the realization of a more effective decision-making process. Many powerful data visualization tools also came into being, such as Power BI, Grafana, Kibana, etc.
Summary
This article introduces all things Grafana and shares a project using Grafana to build a weather station on reTerminnal. reTerminal is a Raspberry Pi device ideal for a reliable and convenient data visualization. Then the importance of data visualization is expounded. Hopefully the above content will give you a better understanding of Grafana and its use.