Build a TinyML Smart Weather Station with Wio Terminal
Updated on Feb 28th, 2024
In today’s tutorial, learn to create your own Wio Terminal Smart Weather Station with TinyML powered prediction capabilities! This article is a complete step-by-step guide to get this project up and running with your Wio Terminal, all the way from data acquisition to training, and finally deploying our smart weather station with Arduino code.
Smart Weather Station: Project Overview
Typically, a weather station project would involve connecting the sensor to our microcontroller platform and reading out this data in real time, either on an LCD display or over an internet connection to an online database.
Today, I want to share the smart version of this weather station project that I created by adding the capability for our Wio Terminal to predict the current weather conditions. With an onboard TensorFlow Lite model, the Wio Terminal becomes able to use real time temperature and relative humidity data for making half-hourly weather predictions!
Let’s first take a look at the completed project with the video below.
Project Requirements
To follow along with this project, the following materials are recommended.
Apart from the Arduino IDE to program the Wio Terminal, you’ll also need a computer with Python 3. We will be working with both Python scripts (.py files) and Python notebooks (.ipynb files). If you are new to Python, my code editor of choice is Microsoft’s Visual Studio Code. It can open both the types of files we need for this project, and has a set up guide that you can follow here.
What is TinyML: TensorFlow Lite
Machine learning has become a real buzzword in the recent decade, giving us amazing functionality like predictions, image recognition and anomaly detection. Traditionally, you might think of machine learning as a computationally intensive task – which is true! Modern deep neural networks used for advanced machine learning tasks are trained on powerful GPUs and ASICs customised for deep learning training, with massive amounts of data.
However, a new concept in machine learning aims to bring these very applications to less powerful, but compact and convenient edge computing devices like MCUs (microcontroller units). This is TinyML.
In broad terms, TinyML seeks to optimise machine learning models to take up less space and require less computational power to use. Most notably, Edge Impulse is a user friendly platform that allows you to build your own datasets, train your own optimised TinyML models that can then be easily deployed.
For today’s project, however, we will be using the TensorFlow Lite library. TensorFlow is an open source machine learning platform maintained by Google, with its Lite version targeted at the optimisation of models for TinyML.

Getting Temperature & Humidity Data: 3 Ways
The first part of this tutorial involves getting the historical data for your area or city. Believe it or not, it’s actually quite hard to find accessible historical data even for simple temperature and relative humidity measurements.
In summary, there are three primary ways that you can get this data.
1. Measure and Collect the Data Yourself
If you’re planning on making a weather station, chances are that you already have a microcontroller and temperature/humidity sensor. If so, you can use a simple Arduino program to pull environmental data at set intervals to build your own dataset over time.
While this seems easy and convenient, the time it would take to pull sufficient data (at least a few hundred) to train any kind of machine learning model would take ages! Even with one reading every hour, and considering cyclical weather patterns throughout the day, even one week’s worth of readings would yield only 7 unique sets of data points. Not to mention, you’ll have to label the data yourself.
2. Look for a Free Dataset or API
There are numerous APIs (or application programming interfaces) that are available for pulling weather data. However, most of them require a paid subscription to access the historical data which we need.
Depending on where you live, your local agency or weather station might offer this data at no cost. For example, the National Environmental Agency in Singapore offers an API for Weather Data that is free for programmatically querying historical weather data. You can follow the documentation for the API you intend to use for how to get started.
Otherwise, if you’re in the US, the National Centers for Environmental Information also provides up-to-date hourly data that can be requested for in CSV format on their website. Otherwise, you can follow this article to pull that data programmatically as well.
3. Scrape the Data with a Python Script

Many websites such as Wunderground provide detailed historical weather data for referencing at no cost, but they often aren’t in an easily processable format like CSV that we need for machine learning. We can circumvent this problem by using a program (often Python is used) to open the web pages and copy this data down for us. This is known as Web Scraping, and is the method I’ve used for today’s project.
Web Scraping Weather Data with Python
To make things easier for everyone following along with the article today, I’ve referenced this article by Angel R. as well as this post on StackOverflow to create a Python script for this purpose. This script will automatically pull data from Wunderground’s historical daily weather data, then produce the data in a beautiful CSV file.
Before we get to the code, visit wunderground.com and navigate to More > Historical Weather as shown below.
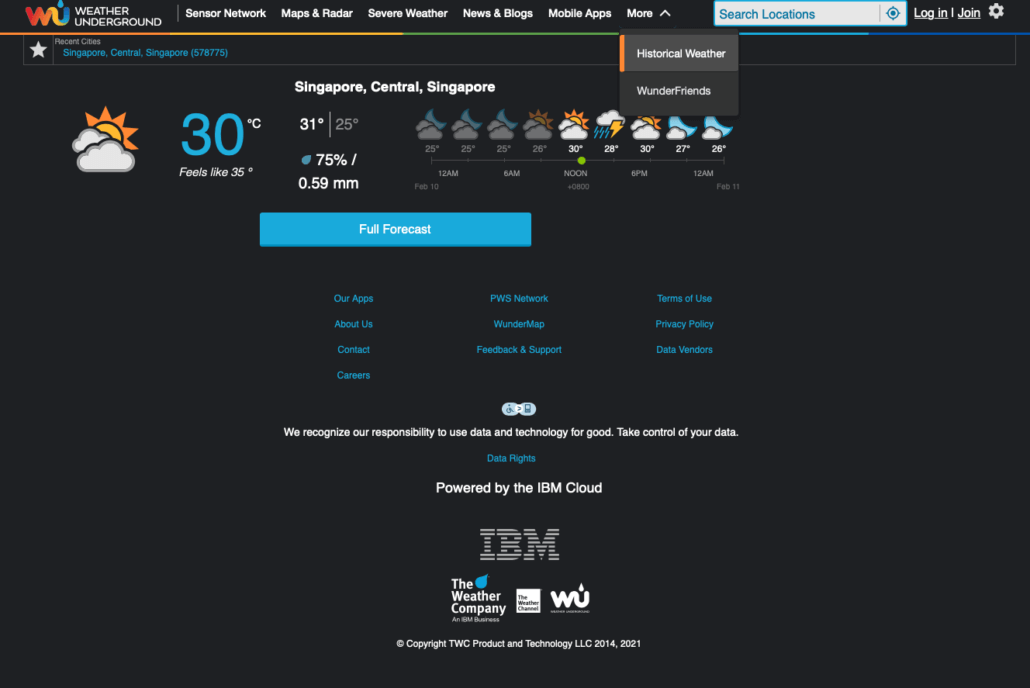
You’ll want to enter your location so that you can obtain data for and train your weather station to interpret weather conditions that are in your area. You can also enter the date that you want to start getting weather data from – I’ve chosen 1 Jan 2020.

After clicking view, a new web page should load. You can take a look around to see what we’re working with, but what we really want to get is the URL of this page. Ideally, it’ll have the same format where we have the last section as the date of the weather data that’s being shown. Note this URL down.

Now we can get started with the web scraping. Download the code for this project as a ZIP file from the following link. Then, open the GetWeatherData.py file with your code editor of choice.
Before you can run the script, you will need to install the following Python packages with the command in your computer’s command line or terminal. These packages will help us parse web page data without us having to actually open it, and handle the recorded data later on.
pip3 install numpy pandas beautifulsoup4 seleniumThe first part of the code that you will need to replace is the lookup_URL. This is where you’ll want to place the link that you found in the previous section. Take note, however, that we are replacing the date numbers with “{}”.
lookup_URL = 'https://www.wunderground.com/history/daily/WSSS/date/{}-{}-{}.html'Then, you can define the start date and how many days’ weather data you’d like to collect. I’ve chosen around 400 so that we can help our model get a good grasp of weather patterns all year-round.
start_date = datetime(2020, 1, 1)
end_date = start_date + pd.Timedelta(days=400)
The next thing you need to check is the webdriver. By default, the code will use a chrome webdriver MacOS executable based on the Google Chrome browser to load the web page data. If you are on Windows or want to use another web driver, you can visit here for Firefox and here for Chrome.
driver = webdriver.Chrome(executable_path='chromedriver', options=options)Note: If you get path errors stating that your chromedriver is not found, replace ‘chromedriver’ in the command with the absolute path to your web driver executable file.
We can finally execute the Python file and begin web scraping! Sit back and relax as our program opens each page one by one and harvests its weather data. At this time, you might see something similar to below in your program output.
Gathering data from:  2020-01-01 00:00:00
Opened URL
Gathering data from:  2020-01-02 00:00:00
Opened URL
Gathering data from:  2020-01-03 00:00:00
Opened URL
Gathering data from:  2020-01-04 00:00:00
Opened URL
...
Finally, we get a CSV file with all the historical weather data we need, ready for building our machine learning model!

Training our TensorFlow Lite Model
This next section of our project will utilise the BuildTFLiteModel.ipynb file. Python notebooks are a type of Python file that is popular for data science and machine learning. They allow Python code to be run in chunks, which means that we can work through our project progressively and easily reference the outputs from previous parts.
Note: While the chunks can be run individually, it’s important to run this notebook in order. Otherwise, the code will not work as intended.
Once again, you’ll have to install the following libraries before we begin. Scikit-learn is another popular machine learning library. It also has some useful data processing functions that we will utilise for this project.
pip install tensorflow scikit-learnOur primary objective is to utilise real time temperature and humidity data to predict the present weather conditions. Hence we’ll drop the other columns that aren’t necessary. We’re also parsing the temperature and humidity values from strings into integer values while converting the temperature units to Kelvin (K).
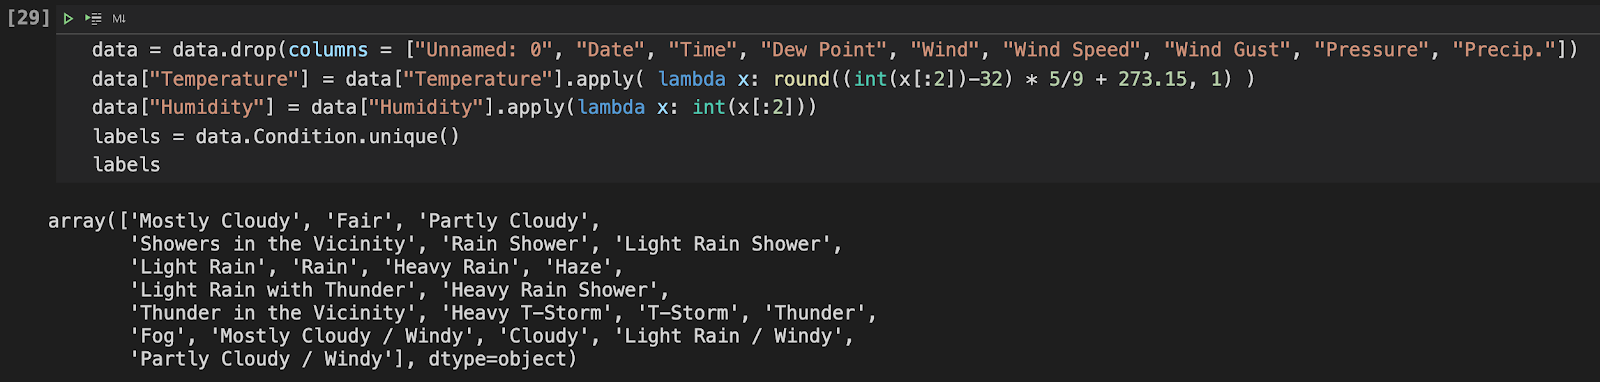
This next step is important and has to be done by you. In the previous chunk, we displayed the unique labels for our weather conditions. Because there are so many possible outputs for our model that only fundamentally takes two inputs, we will have to convert these labels into three primary categories.
In the next chunk, you’ll see three lists that group these labels into “No Rain”, “Might Rain” and “Rain”. The values are then one-hot encoded to represent our categories numerically. You can eventually adjust these labels to be more useful for the climate where you live.
norain = ['Mostly Cloudy', 'Fair', ... , 'Partly Cloudy / Windy']
mightrain = ['Showers in the Vicinity', 'Thunder in the Vicinity', 'Thunder']
rain = ['Rain Shower', 'Light Rain Shower', 'Light Rain', ... , 'Light Rain / Windy']
Next, to better make use of our available input data, we will only perform predictions once for a given 7 input window. Each entry from Wunderground represents a reading taken at half an hour intervals. We will follow this and make half-hourly predictions with our implementation with the current + 6 previous half-hourly readings.
This allows us to provide more features for our model to recognise the patterns between the input and outputs, which should improve classification performance. Check that the lengths of the x and y array are the same to ensure that this step has been completed successfully.
y = processed_data[["NoRain", "MightRain", "Rain"]].to_numpy()[7:]
rawx = processed_data.drop(columns = ["NoRain", "MightRain", "Rain"]).to_numpy()

x = []
temp = np.array(0)
for i in range(len(rawx)-7):
    temp = rawx[i:i+6].flatten()
    x.append(temp)
x = np.array(x)
x.shape, y.shape
The next chunk splits the data into training and testing data.
xtrain, xtest, ytrain, ytest = train_test_split(x, y, test_size = 0.20, random_state = 33)Then, we will proceed to define our model before compiling it and fitting it to our data. If you are new to Keras machine learning models and would like to learn more, you can visit this short read for beginners by Palash Sharma.
model = tf.keras.Sequential()
model.add(Dense(14, activation='relu'))
model.add(Dense(8, activation='relu'))
model.add(Dense(3, activation='softmax'))

model.compile(loss = 'categorical_crossentropy',
              optimizer = tf.optimizers.Adam(),
              metrics=['accuracy'])

model.fit(xtrain, ytrain, epochs=10, validation_split=0.1)
The last two chunks are arguably the most important – we have to use the TF Lite converter to transform our keras model into a TF Lite model that is small enough and in a format that we can use for inferences on our Wio Terminal.
Once you have run the final chunk, a model.h file should have been written to the folder. This header file is how we will bring our trained TF Lite model to Arduino! For the final step in this section, use this file to replace the model.h file in the WioTerminal_SmartWeatherStation folder where the Arduino code resides.
Implementing Machine Learning on the Wio Terminal
It’s finally time to move on to implementing our model on our Wio Terminal.
Hardware Setup
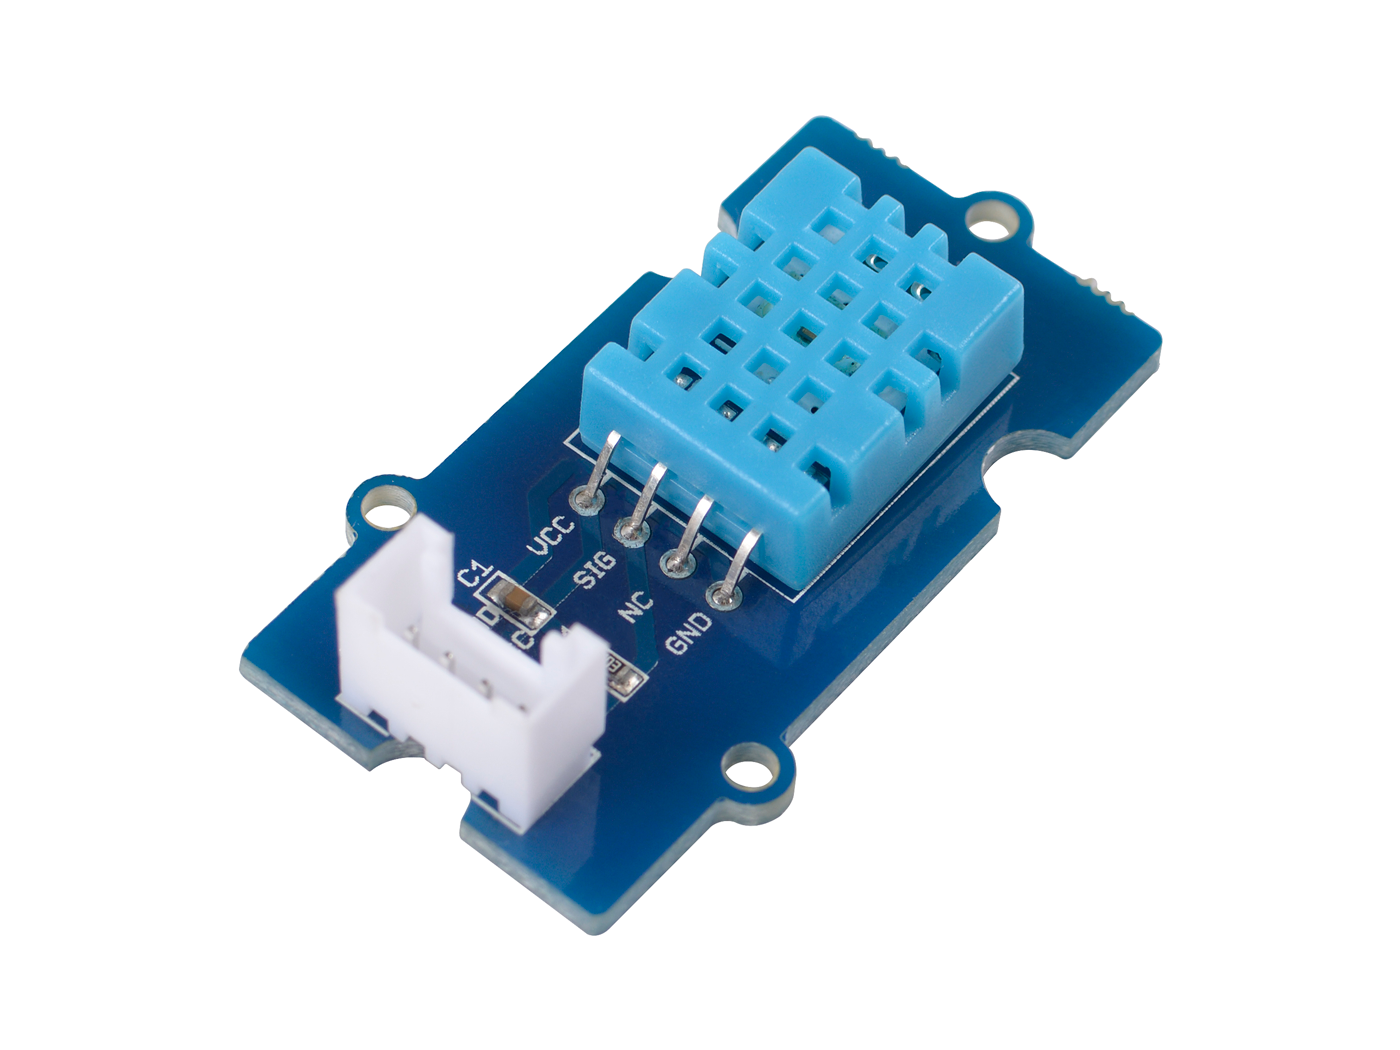
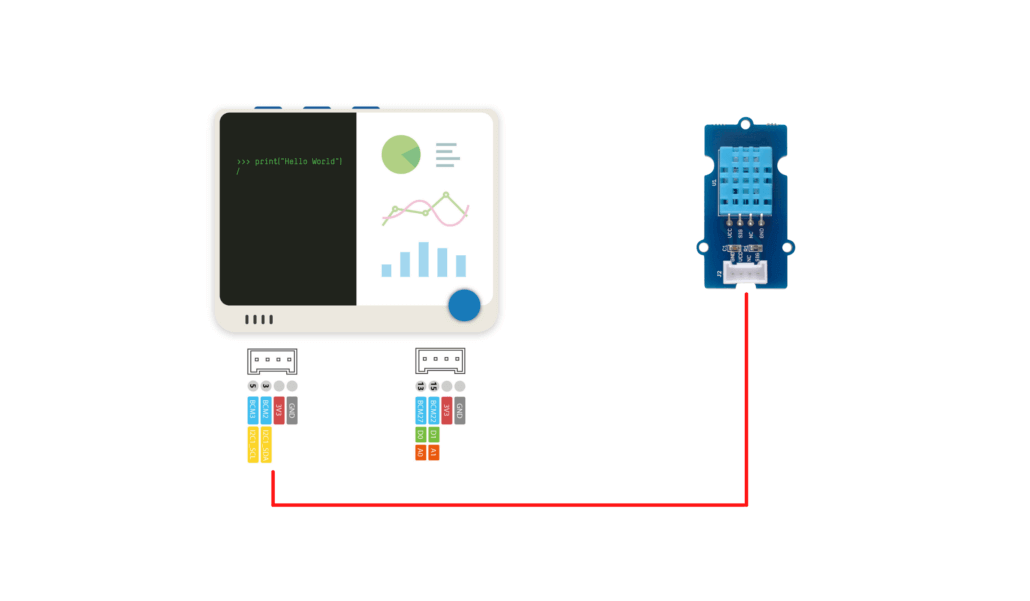
Plug your DHT11 temperature and humidity sensor into your Wio Terminal as shown below.
Install the Wio Terminal Libraries
- First of all, if this is your first time working with the Wio Terminal, it’s highly recommended to first get started here.
- Download and install the Seeed DHT Library. If you are new to installing Arduino libraries via ZIP files, you can follow these instructions.
- Finally, install the Arduino TensorFlowLite library through the Tools > Manage Libraries. I will recommend installing Version 2.1.0 since that is the library that I’ve had success with. However, others have reported issues with precompiled libraries, so your mileage may vary.

Prepare the Arduino Code
There’s only one thing that you’ll have to take note of before flashing the code to your Wio Terminal. If you changed the labels on your model’s outputs, you’ll want to edit the following parameters accordingly.
const char* OUTPUTS[] = {
    "No Rain",
    "Might Rain",
    "Rain"
};
int NUM_OUTPUTS = 3;
Arduino Code Highlights
The more ‘challenging’ implementation of this Arduino code involves how we will build a FIFO (first-in-first-out) structure to manage our 7-reading window. Take a look at the truncated code below:
if (array_count == 0 | millis() - dataMarker > 30 * 60000) {
      dataMarker = millis();

      for (int i=0; i<12; i++) {
        temp_hum_val[i] = temp_hum_val[i+2];
      }

      temp_hum_val[12] = reading[1] + 273.15;
      temp_hum_val[13] = reading[0];
      array_count ++;

      if (array_count > 7) array_count = 7;
      if (array_count == 7) {

        // Copy array into tensor inputs
        for (int i=0; i<14; i++) {
          tflInputTensor->data.f[i] = temp_hum_val[i];
        }

        // Run inference on data (not shown)
        // Get and display output (not shown)
      }
}
When we first start the Wio Terminal, we will have array_count at its initialised value of 0. We will use this variable to record the total number of readings that we have taken to ensure that we have at least 7 readings for machine learning model’s prediction.
The for loop shifts all values’ indices forward by 2, essentially deleting the earliest temperature and humidity readings. Then, we will assign the latest sensor readings to the back of the queue and increment the array_count value.
for (int i=0; i<12; i++) {
        temp_hum_val[i] = temp_hum_val[i+2];
}
Every half an hour after this, we will run this code again to sample the data until we have built up an array of 14 values (ie. array_count == 7). Once the array_count value reaches 7, we will copy the stored temp_hum_val array values to the model input pointers and begin invoking the TF Lite interpreter for predictions.
Managing Memory on the Wio Terminal
When you make edits to the Arduino sketch, it’s important to remember that the amount of memory we have on our Wio Terminal is a mere 192 kilobytes. I’ve had my Wio Terminal freeze up numerous times when it called the AllocateTensors() function, which I highly suspect is due to a lack of available memory.
Hence, it’s best to keep things in this sketch lightweight, especially with regard to the variables that you declare prior to your TF Lite interpreter being successfully initialised!
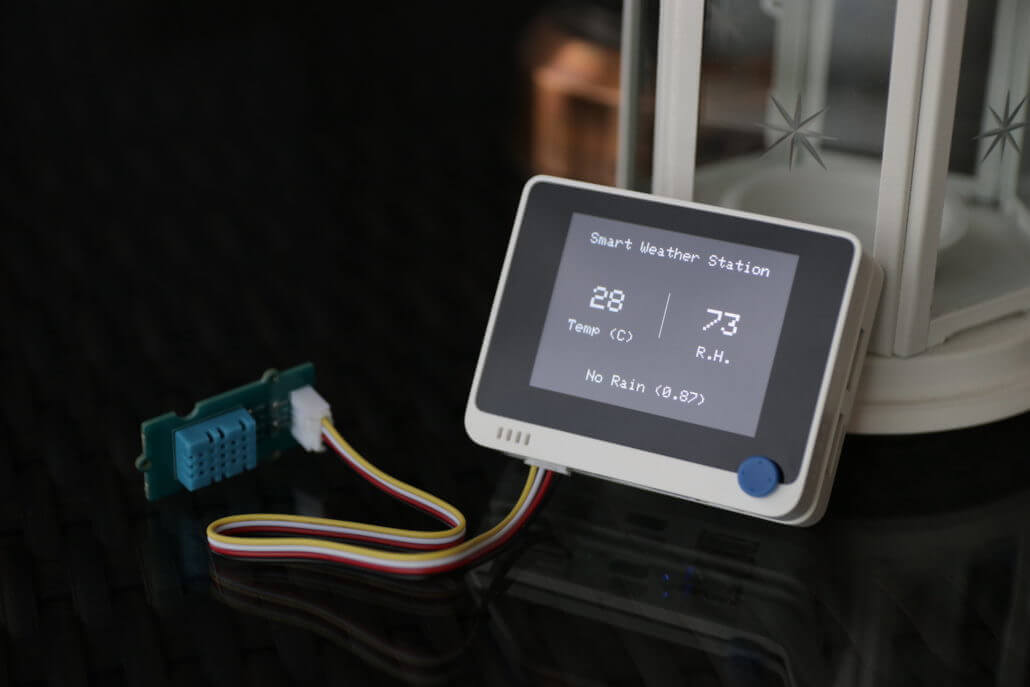
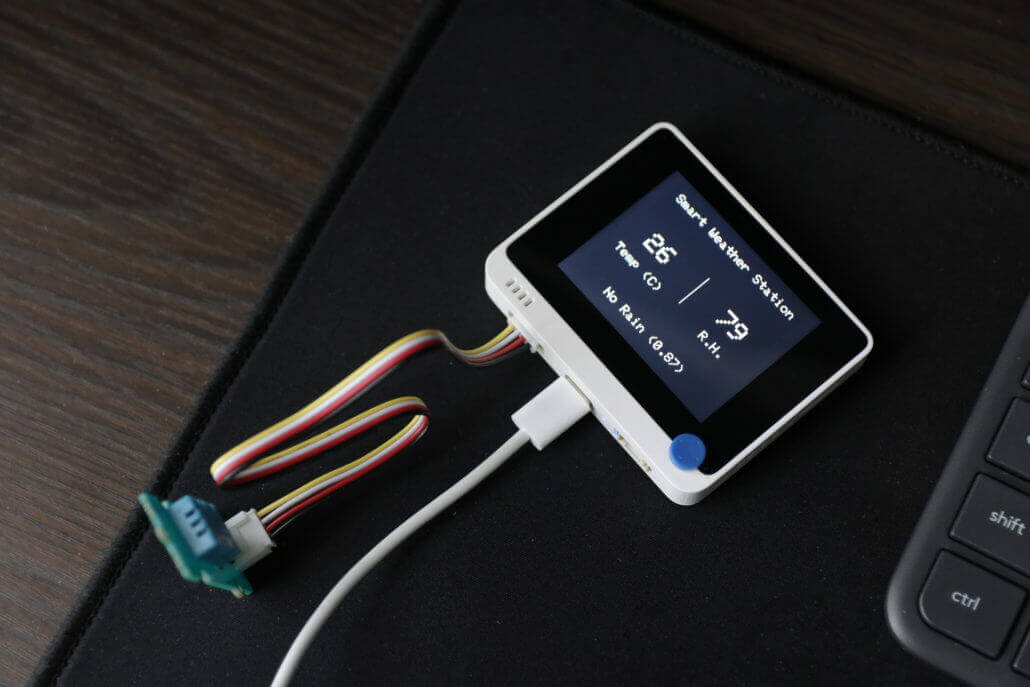
The Final Product
Our TinyML smart weather station is now ready for action! The image below demonstrates what you should see once 7 half-hourly readings have been accumulated. The prediction will continue to be updated half-hourly with the new data that comes in! In your testing, you can reduce the interval between new readings being put into the model input array to check that your interpreter is working as intended.
Summary
I hope that this tutorial has been helpful for those of you who are looking to build a smart weather station! It’s also a very basic introduction to enabling TinyML with TensorFlow Lite on a microcontroller like the Wio Terminal.
Since you’ll be working with your own data, there is a non-negligible chance that some of the code that I’ve provided will not work directly out of the box. Nonetheless, I hope that you will enjoy the learning process and own the satisfaction of completing your very own project!
For more TinyML on Wio Terminal projects, please visit:
- Learn TinyML using Wio Terminal and Arduino IDE #1 Intro
- Learn TinyML using Wio Terminal and Arduino IDE #2 Audio Scene Recognition and Mobile Notifications
For some of my other Wio Terminal projects, you can also visit:
- Wio Terminal: Arduino Smart Doorbell (with Code!)
- Wio Terminal: Arduino Customisable Timer (with Code!)
- Build an MQTT Intercom with Wio Terminal (with Code!)
Choose the best tool for your TinyML project
Grove – Vision AI Module V2
It’s an MCU-based vision AI module powered by Himax WiseEye2 HX6538 processor, featuring rm Cortex-M55 and Ethos-U55. It integrates Arm Helium technology, which is finely optimized for vector data processing, enables:
- Award-winning low power consumption
- Significant uplift in DSP and ML capabilities
- Designed for battery-powered endpoint AI applications
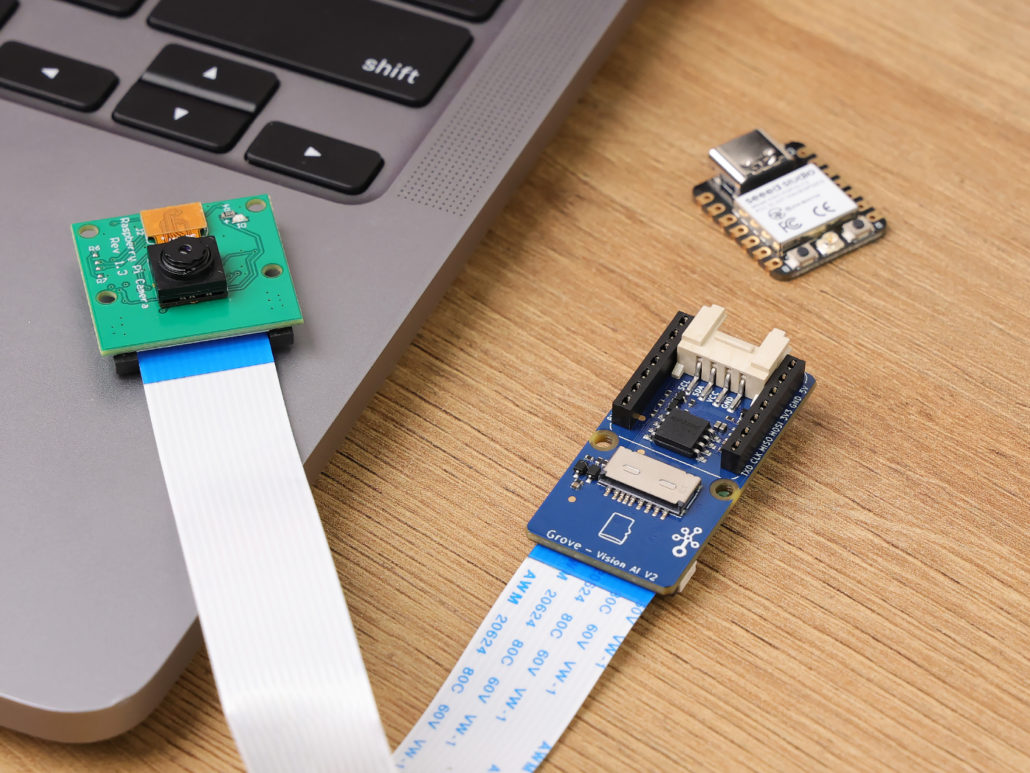
With support for Tensorflow and Pytorch frameworks, it allows users to deploy both off-the-shelf and custom AI models from Seeed Studio SenseCraft AI. Additionally, the module features a range of interfaces, including IIC, UART, SPI, and Type-C, allowing easy integration with popular products like Seeed Studio XIAO, Grove, Raspberry Pi, BeagleBoard, and ESP-based products for further development.
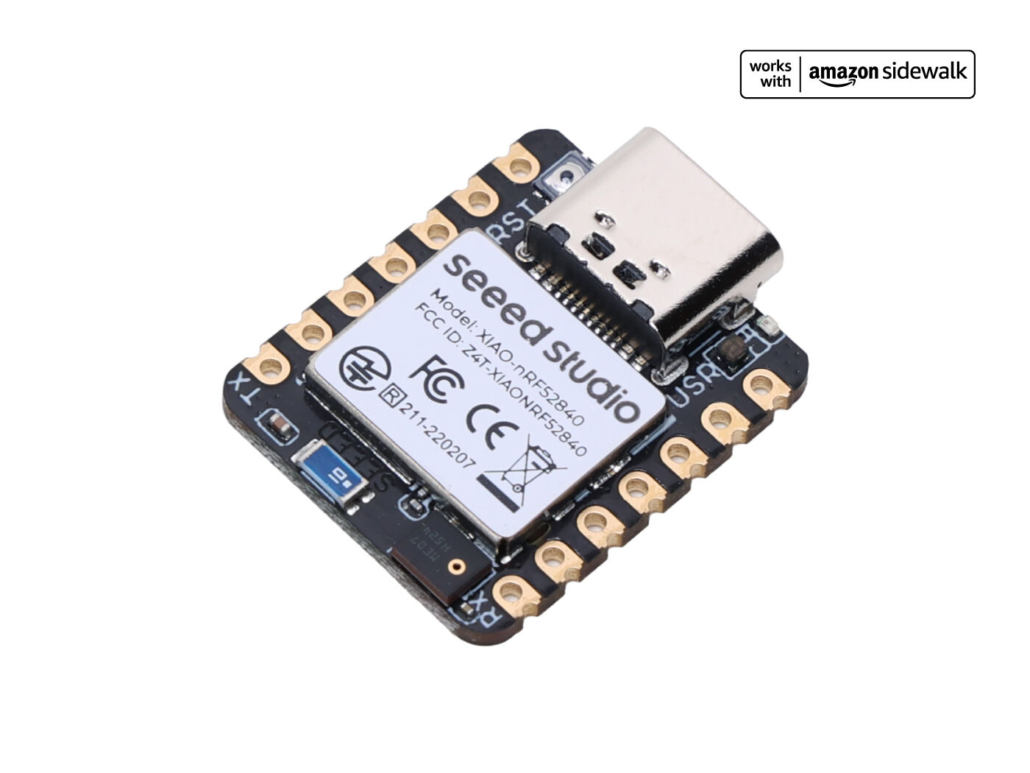
Seeed Studio XIAO ESP32S3 Sense & Seeed Studio XIAO nRF52840 Sense
Seeed Studio XIAO Series are diminutive development boards, sharing a similar hardware structure, where the size is literally thumb-sized. The code name “XIAO” here represents its half feature “Tiny”, and the other half will be “Puissant”.
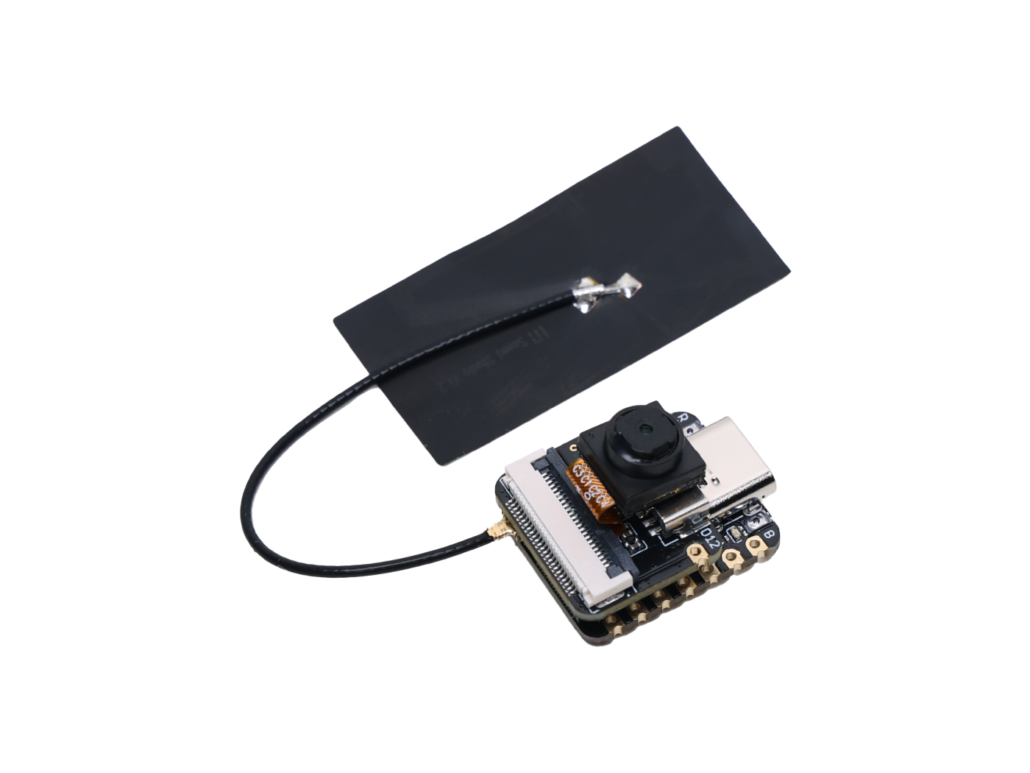
Seeed Studio XIAO ESP32S3 Sense integrates an OV2640 camera sensor, digital microphone, and SD card support. Combining embedded ML computing power and photography capability, this development board can be your great tool to get started with intelligent voice and vision AI.
Seeed Studio XIAO nRF52840 Sense is carrying Bluetooth 5.0 wireless capability and is able to operate with low power consumption. Featuring onboard IMU and PDM, it can be your best tool for embedded Machine Learning projects.
Click here to learn more about the XIAO family!
SenseCraft AI
SenseCraft AI is a platform that enables easy AI model training and deployment with no-code/low-code. It supports Seeed products natively, ensuring complete adaptability of the trained models to Seeed products. Moreover, deploying models through this platform offers immediate visualization of identification results on the website, enabling prompt assessment of model performance.
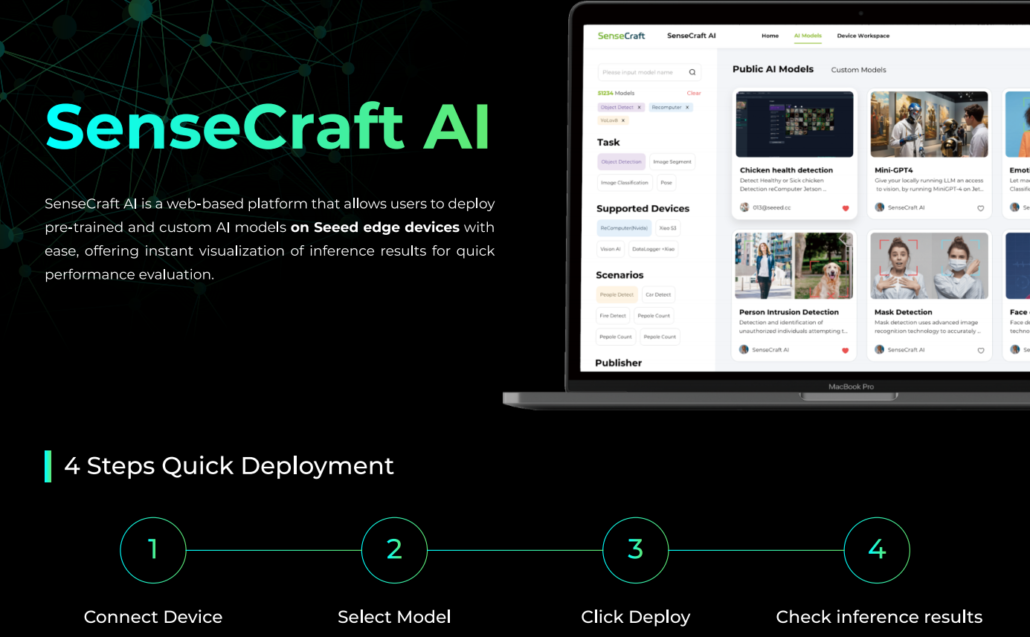
Ideal for tinyML applications, it allows you to effortlessly deploy off-the-shelf or custom AI models by connecting the device, selecting a model, and viewing identification results.