Wind Farm Weather Station: S200 Wind Data for Investigating Low Turbine Output
At a wind farm, wind speed and direction shape both turbine operation and the site’s generation plan. Turbines yaw to face the wind, adjust blade pitch, and start or stop at their specified cut-in and cut-out speeds to capture energy within their operating range. The operations team also combines local wind measurements, weather forecasts, and turbine records to estimate the farm’s output over the coming hours. Grid operators use that forecast to schedule generation and reserves and accommodate changing wind supply. When actual output falls below plan, local wind records help the team investigate the shortfall and update its forecast.
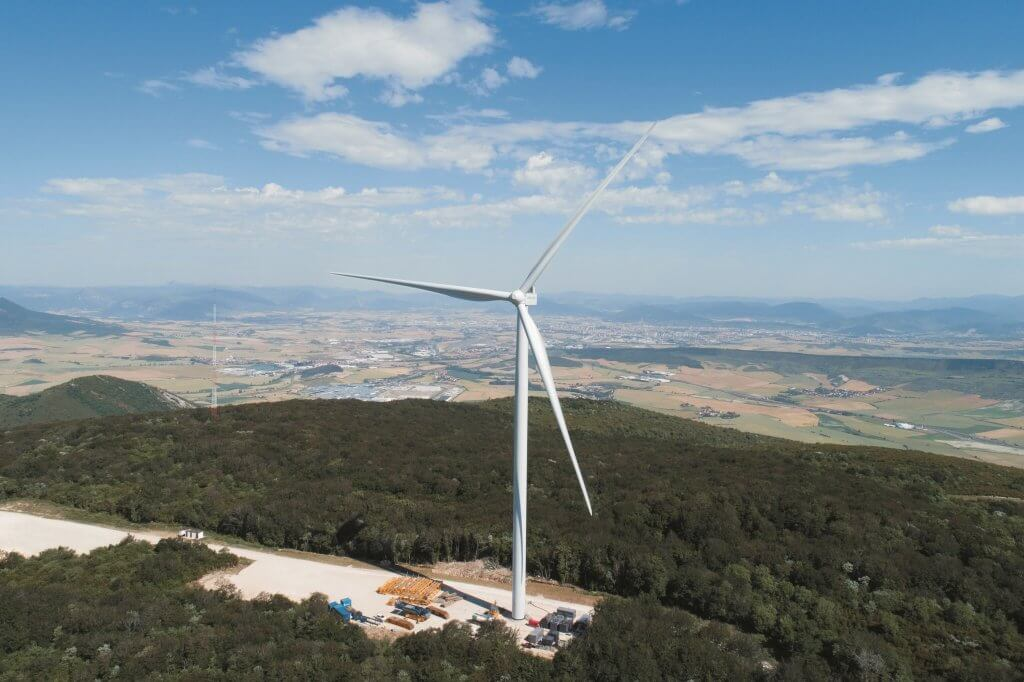
A Low-Wind Period Across an Iowa Wind Farm
When Vincent starts his morning shift, the wind farm is generating less electricity than planned. He needs to revise the day’s output expectation and decide whether the shortfall calls for turbine checks.
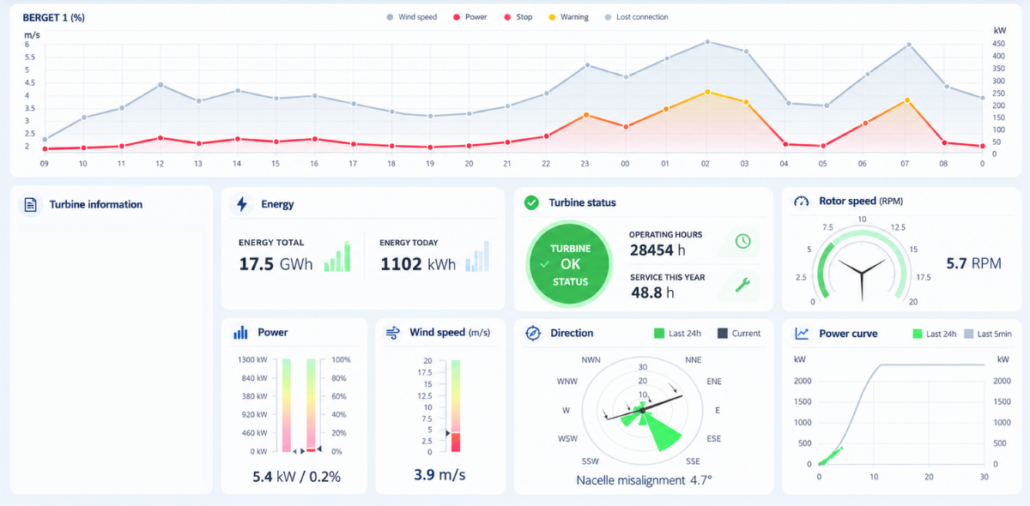
He compares wind speed and direction recorded by SenseCAP S200 sensors at representative points across the site with the weather forecast and each turbine’s operating record. Wind speeds have fallen across the monitored areas, and output is lower across most of the fleet. Vincent updates the short-term generation forecast and moves planned maintenance into the weak-wind period.
One turbine still stands out: under similar recorded wind conditions, its output remains below that of nearby units. Vincent flags it for a closer look at its nacelle direction, yaw activity and operating history.
Use S200 Weather Station’s Wind Data for Two Operating Decisions
Wind Tracking: Prioritize a Yaw Investigation
A turbine measures wind direction, compares it with the nacelle’s orientation and uses its yaw motors to turn the rotor toward the incoming wind. Vincent uses S200 readings as a separate record of conditions at the site. He compares those readings with the turbine’s wind direction, nacelle position, yaw events and output over the same periods.
If the same turbine repeatedly shows a directional offset and lower output under comparable site conditions, the team can prioritize that unit. Its next check focuses on the turbine’s wind-direction measurement, yaw settings and related components. The S200 record turns a broad “output is low” alert into a specific maintenance investigation.
Rising Wind: Prepare Crews and Review Turbine Responses
Later, wind speeds begin rising at one side of the site. Vincent follows the change through the S200 records to see where stronger winds arrive first. He adjusts outdoor work and inspection schedules for those areas, then compares the wind timeline with turbine power-limiting and shutdown records.
Each turbine’s own controller uses its wind measurements to manage operation, including blade pitch and shutdown in high winds. The site-level S200 record helps Vincent check the sequence of events and put the first affected turbines at the top of the post-event inspection list. That gives the maintenance team a clearer route for checking the turbine and blade protection responses after the wind passes.
Deployment: Keep Wind Monitoring Practical Across an Open Site
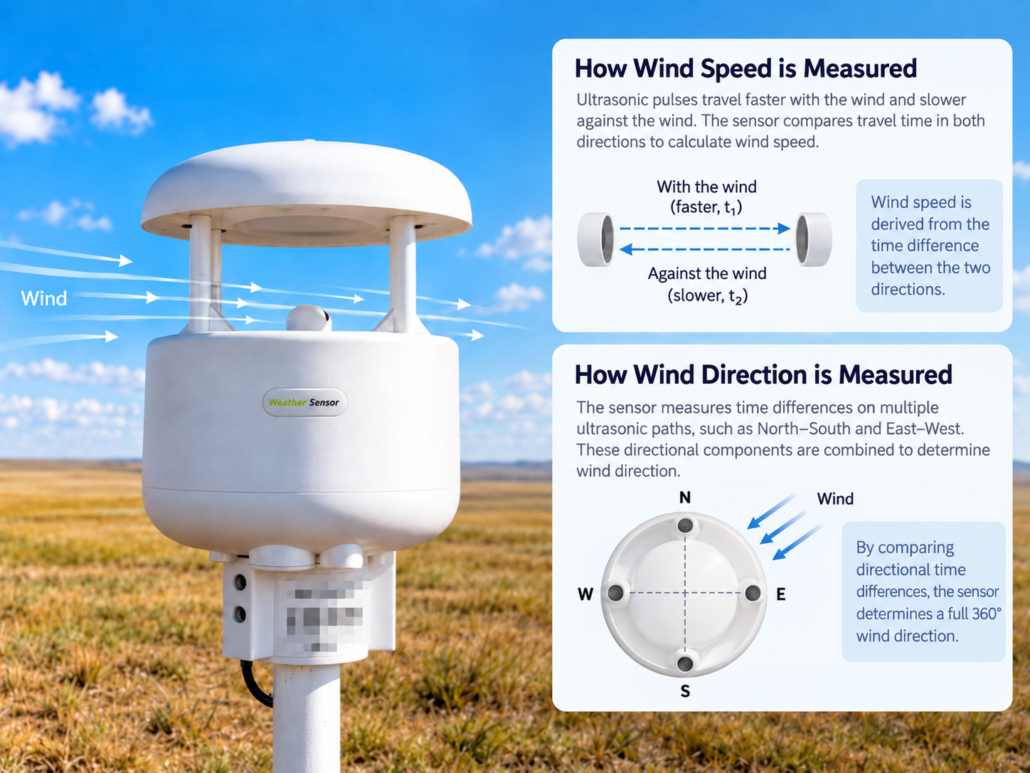
SenseCAP S200 combines ultrasonic wind speed and direction measurement in one compact sensor head. Vincent’s team can place sensors at representative, unobstructed points across the open wind farm without installing separate wind cups and vanes at each point. Its ultrasonic measurement has no rotating wind-measurement parts, reducing work associated with inspecting or replacing cup bearings and vane mechanisms at dispersed locations. The IP66 enclosure protects the sensor against dust and rain at outdoor mounting points.
For interpreting a low-wind period or a directional offset, the team keeps each sensor’s mounting position and height in the site record. That lets Vincent compare readings from the same observation point over time and select the relevant record when reviewing nearby turbines.
Wind Farm Weather Station Data for Turbine Alignment and Power Forecasting
By the end of the shift, Vincent has separated the site-wide wind lull from the turbine that needs investigation. The team has revised its near-term generation forecast, used the quieter period for planned maintenance and assigned a targeted yaw check. When stronger winds arrive later, the same observation network gives the crew a timeline for reviewing turbine responses and ordering inspections.
Those are the operational results illustrated by this scenario. Measured changes in forecast error, inspection trips, downtime or component condition would require records from an actual deployment.
If you have similar weather monitoring needs, contact us at [email protected]. Tell us about your project, and the Seeed team will put together a detailed solution for you.
Seeed Studio is helping lead this transition through the SenseCAP weather station portfolio. SenseCAP combines industrial-grade sensing, compact all-in-one hardware, open communication protocols, flexible data paths, and a repeatable deployment architecture.
Seeed Studio works with more than 200 partners and over 1,000 customers across 120+ countries, with SenseCAP deployments spanning greenhouse and vineyard monitoring, smart-city observation, renewable-energy sites, environmental research, and industrial facilities. This is the direction professional weather monitoring is taking, and SenseCAP is building the products and integration ecosystem needed to move it forward.
Notes: This article is based on a real customer project. Names and identifying location details have been changed to protect the customer’s identity. Images sourced online are used for visual reference.
About Author
