Hydropower Plant Weather Station: How S700-C Supports Reservoir and Generation Decisions
A reservoir hydropower plant stores water upstream of a dam, then releases it through turbines to generate electricity. Its operators decide how much water to use for generation, how much to release downstream, and how much storage to keep available for incoming flows. A hydropower plant weather station gives them local observations to consider when planning those decisions.
This case follows a spring operating day at our client’s Alpine hydropower plant, where rain and melting mountain snow can change the amount of water entering the reservoir. Our client asked Seeed how to build a weather monitoring system that would cover conditions across the catchment while reducing routine maintenance and inspection visits. The sections below show how the resulting observations help the team review inflow forecasts and make daily reservoir and generation decisions.
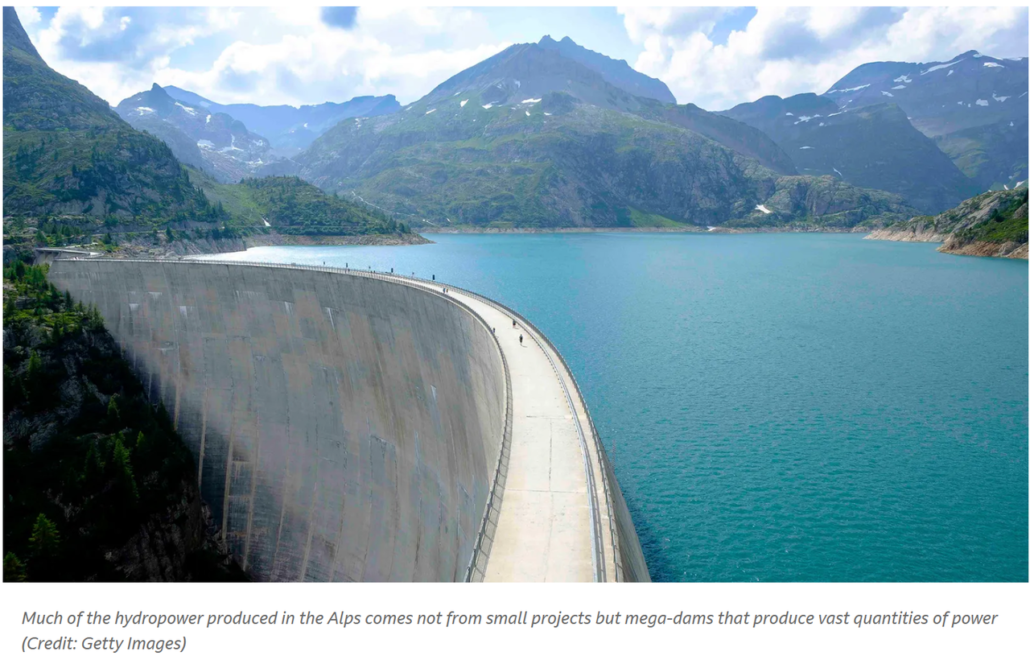
Description of the role of the hydroelectric power station in the Alps region provided by the BBC official. https://www.bbc.co.uk/future/article/20221129-the-alpine-villages-producing-their-own-power
Challenge: Rain and Snowmelt Change the Water Available to Manage
The hydropower plant stores seasonal snowmelt for electricity generation while preserving flood storage and following scheduled downstream releases. Each morning, the duty team reviews reservoir level, upstream stream gauges, the inflow forecast, approved release limits, and the generation schedule. In spring, conditions can change between the high snow zone, the upper rain catchment, and the dam. A single reading at the powerhouse gives the operators little lead time to revise the coming day’s water balance.
A Storm Reaches an Already Warming Watershed
A warm spell has begun to soften the snowpack when rain reaches the upper catchment. Thomas, the dispatch lead, has a 24-hour release schedule already shared with the control room and downstream operators. He must make space for the added inflow, coordinate changes to the downstream release, and keep the turbines on a workable generation schedule. An earlier forecast called for 40–50 m³/s of inflow across the four six-hour blocks; a rising upstream gauge now makes that plan worth revisiting.
The Dam Team Needs More Than a Rainfall Reading at the Powerhouse
The team places observations at an upper rain-exposed site, a representative snow-zone site, and the dam area. The first shows where rain enters tributaries before it reaches the hydropower plant. The second records the air temperature and solar radiation associated with the changing melt conditions. The dam station documents local weather during inspections and gate work. Thomas reads each observation against its location, then checks the stream gauges and the watershed forecast before changing the inflow estimate.
| Monitoring location | Measurement for this event | Operational use |
| Upper rain catchment | Radar rainfall intensity and event total | Update rain-runoff inputs and verify the forecast against tributary gauges |
| Representative snow zone | Air temperature and global solar radiation | Review warming and melt conditions in the snowmelt model |
| Dam area | Local rain and temperature | Plan site inspection and record conditions during release changes |
Rainfall and melt conditions can vary across an upland basin. USGS research on reservoir snowmelt planning describes why higher-elevation rainfall and changing melt timing matter to the space available in a hydropower plant.
Solution: Connect Hydropower Plant Weather Station Data to Operating Decisions
Track Rainfall Where Runoff Begins
At the upper site, the SenseCAP S700-C records 14 mm of rain during the 06–12 block and another 36 mm during the 12–18 block. The dam-area station records just 2 mm and 11 mm in the same periods. Thomas alerts the hydrology team to the concentrated rainfall upstream. They update the rainfall–runoff inputs and compare the revised inflow trajectory with rising tributary gauge readings.
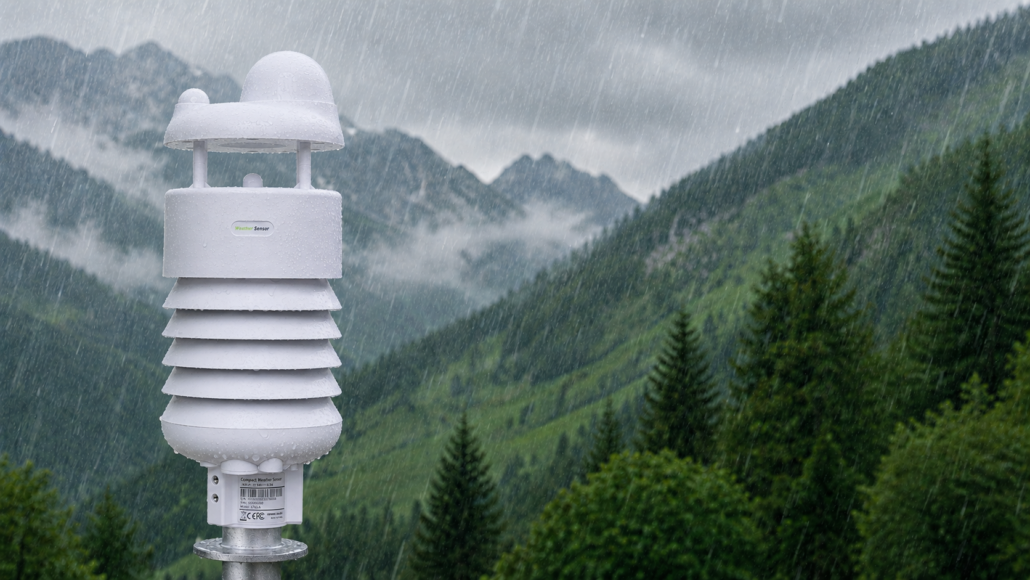
S700-C gives them a local record from the part of the basin receiving the rain. Its radar sensor detects falling raindrops without collecting water in a funnel, removing the tipping mechanism from the rainfall measurement. It measures rain intensity from 0 to 300 mm/h, with a resolution of 0.01 mm/h. The same station also records relative humidity with an accuracy of ±1.5% RH and barometric pressure with an accuracy of ±50 Pa, allowing the team to review the changing weather conditions alongside the rainfall record.
Watch Temperature and Solar Radiation During Snowmelt
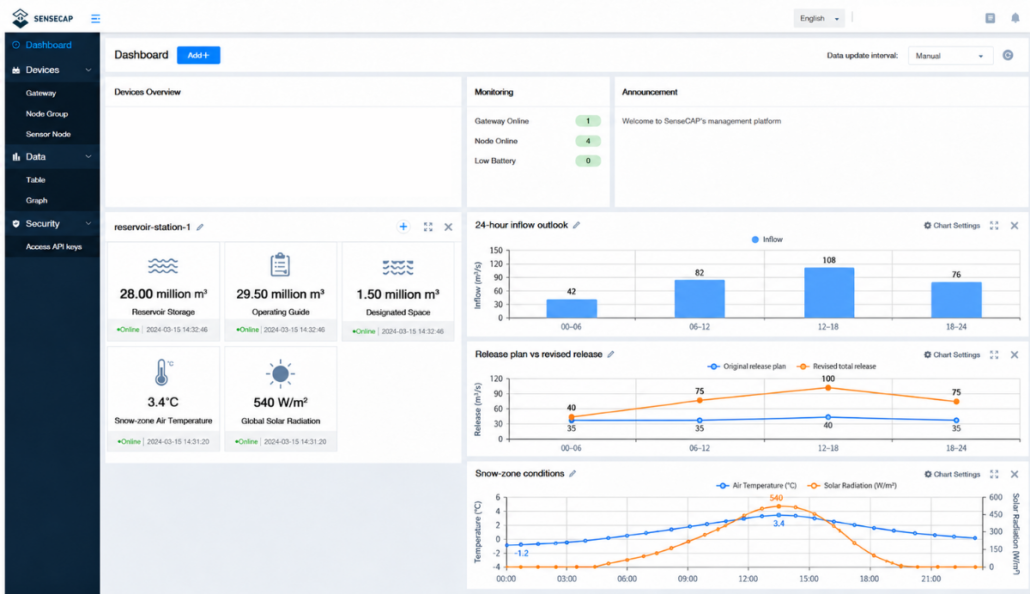
At the snow-zone site, S700-C records air temperature rising from −1.2°C overnight to 3.4°C by midday, while global solar radiation reaches 540 W/m². Thomas brings these observations into the hydrology team’s snowmelt review, together with the upper-site rainfall and tributary gauge readings. The revised 24-hour inflow outlook is 42, 82, 108, and 76 m³/s across successive six-hour blocks.
Measuring temperature and solar radiation at the snow-zone site gives the team local inputs for that review. S700-C specifies ±0.1°C temperature accuracy and a solar radiation measurement range of 0–2,000 W/m². Both measurements come from the same station that records the upper basin’s radar rainfall, so the team can examine the rain and melt conditions behind the updated inflow outlook in one site record.
Decisions: Use Hydropower Plant Weather Station Data to Plan Storage, Releases, and Generation
Protect Flood Storage and Prepare Dam Area Operations
At the start of the event, the hydropower plant holds 28.00 million m³ against an operating guide of 29.50 million m³, leaving 1.50 million m³ of designated space. Holding the original releases of 35, 35, 40, and 35 m³/s against the inflow now indicated by the gauges would add 3.56 million m³ by the end of the day. Thomas reviews the approved downstream flow envelope with the river coordinator and changes total releases to 40, 75, 100, and 75 m³/s. The dam crew checks gate readiness and access routes before the two scheduled increases; the control room records hydropower plant level and tailwater conditions as each change takes effect.
Revise the Turbine Generation Plan
Richard, the control room operator, assigns 35, 55, 60, and 55 m³/s of those releases to the turbines, with the balance routed through the agreed non-generation outlet. This puts more turbine water in the middle two blocks while keeping the total release on Thomas’s downstream schedule. His shift sheet tracks the unit flows, operating levels, and the next inflow update.
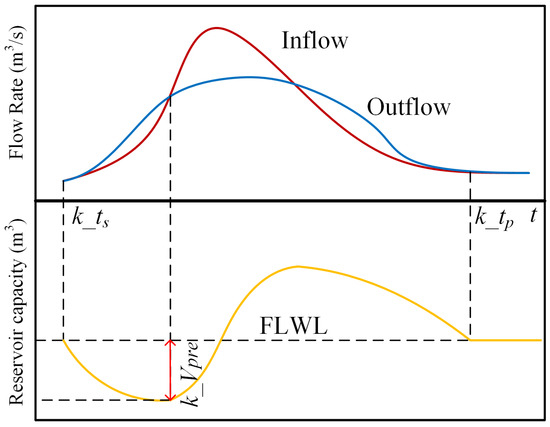
Change in storage is approximately (inflow − total outflow) × time. hydropower plant operating studies likewise combine inflow forecasts with current storage and release objectives when exploring a change of plan.
Across the first year in this illustrative deployment, the compact 140 × 140 × 350 mm sensor head lets the field crew use a straightforward pole layout at each weather site. Radar rainfall and ultrasonic wind sensing have no moving collection or cup assemblies to service; the crew still schedules access for inspection and cleaning around spring runoff. The IP66 enclosure and specified −40°C to +85°C operating range suit exposed stations subject to windblown sediment and rain splash. The team specifies corrosion-resistant pole hardware and places cable junctions above sediment-laden flood paths, so the mount and wiring match the site conditions as well as the sensor.
The operator chooses the S700-C‘s RS485 Modbus-RTU output to bring weather records into its existing supervisory monitoring platform. Mapping rainfall intensity, air temperature, and solar radiation to existing tags lets Thomas review them beside stream-gauge and reservoir-level data. The team adds watershed observations to the established dispatch view without replacing that view or retraining operators on a second dashboard.
Plan a Hydropower Plant Weather Station Deployment with SenseCAP
The original plan assumed modest inflow and nearly steady releases. Upper-catchment rain reached 36 mm in the midday block while the snow-zone station registered 3.4°C and 540 W/m²; the stream gauges rose in the same operating window. Thomas’s team revised the inflow forecast and staged the downstream releases after coordinating the permitted flow sequence. Richard shifted turbine use toward the two middle blocks and logged the bypass share separately. The end-of-day gauge record averaged 40, 85, 110, and 75 m³/s of inflow; releases averaged 40, 75, 100, and 75 m³/s. The storage ledger ended at 28.43 million m³, leaving 1.07 million m³ beneath the operating guide. The unit log showed the revised turbine blocks completed to the agreed schedule. For the nearby community, the tangible result was an orderly downstream release sequence alongside the station’s generation duty.
Planning a hydropower plant or catchment monitoring project? Tell the Seeed Studio team at [email protected] where runoff begins, which snow and dam zones matter to your operators, and what data your monitoring platform accepts. Seeed Studio is helping lead this transition through the SenseCAP weather station portfolio. SenseCAP combines industrial-grade sensing, compact all-in-one hardware, open communication protocols, flexible data paths, and a repeatable deployment architecture.
Seeed Studio works with more than 200 partners and over 1,000 customers across 120+ countries, with SenseCAP deployments spanning greenhouse and vineyard monitoring, smart-city observation, renewable-energy sites, environmental research, and industrial facilities. This is the direction professional weather monitoring is taking, and SenseCAP is building the products and integration ecosystem needed to move it forward.
Notes: This article is based on a real customer project. Names and identifying location details have been changed to protect the customer’s identity. Images sourced online are used for visual reference.
About Author
