How Weather Monitoring on Buoys Supports Operations on the Water
Water sampling, facility inspections, and equipment maintenance are all affected by local weather. Stronger winds or changes in wind direction may affect navigation, docking, and crew operations. Meanwhile, rainfall can interrupt outdoor maintenance and sampling. Continuous weather monitoring helps teams plan departure times and adjust tasks on site. It also provides environmental records for later review.
Installing weather sensors on a buoy creates a continuous observation point on the water. The sensors measure wind speed, wind direction, rainfall, air temperature, and humidity. Data collection and communication equipment then sends these readings to a management platform. Combined with forecasts, water conditions, and task requirements, these observations help shore-based managers and field teams understand environmental changes. They also support decisions about inspections, sampling, and equipment maintenance.
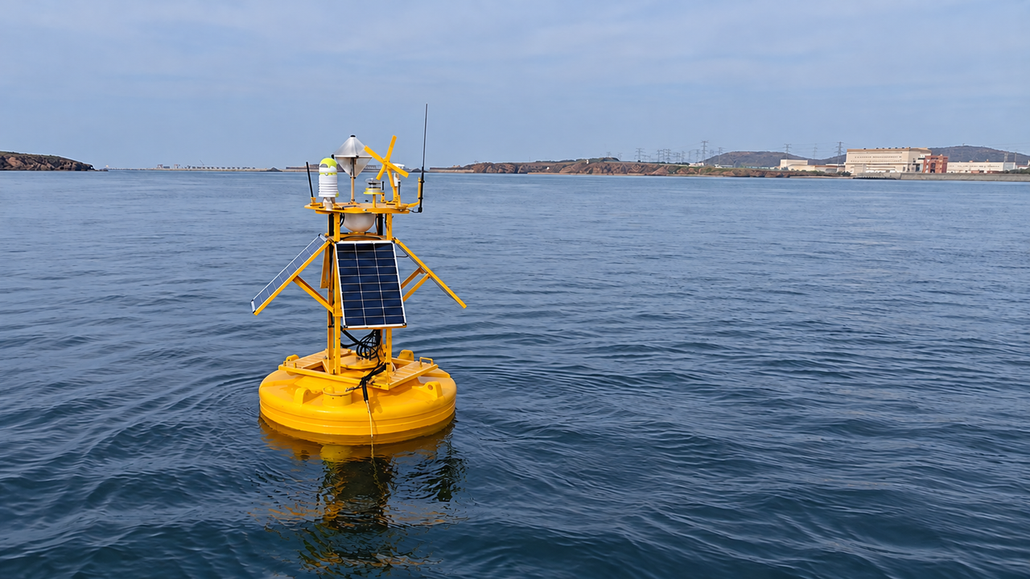
Buoys are widely used for weather observations. The U.S. National Data Buoy Center collects data through more than 100 moored buoys and over 40 coastal observation stations. These observations support operational forecasts, warnings, and numerical models. Its weather buoys measure wind speed, wind direction, gusts, air pressure, temperature, and humidity. They also use separate instruments to measure waves. Together, this network shows how observations on the water provide essential data for marine weather services.
Understanding Wind Changes to Support Operations on the Water
Wind speed and direction both affect operations on the water. Wind exerts force on boats, buoy structures, and exposed equipment. It also transfers energy to the water, generating waves. Under simplified conditions with the same air density, frontal area, and drag coefficient, increasing relative wind speed from 8 to 12 m/s raises wind speed by 50%, but increases aerodynamic drag to 2.25 times its original value. Meanwhile, a single reading before departure cannot describe wind conditions throughout a task. Average wind speed shows overall conditions, while short-term peaks reveal stronger winds. NOAA buoy observations therefore report 8-minute average wind speeds alongside 5- or 8-second gust peaks within the same period. Continuous wind observations, combined with wave, current, and forecast information, provide a stronger basis for planning departures, docking, sampling, and equipment maintenance.
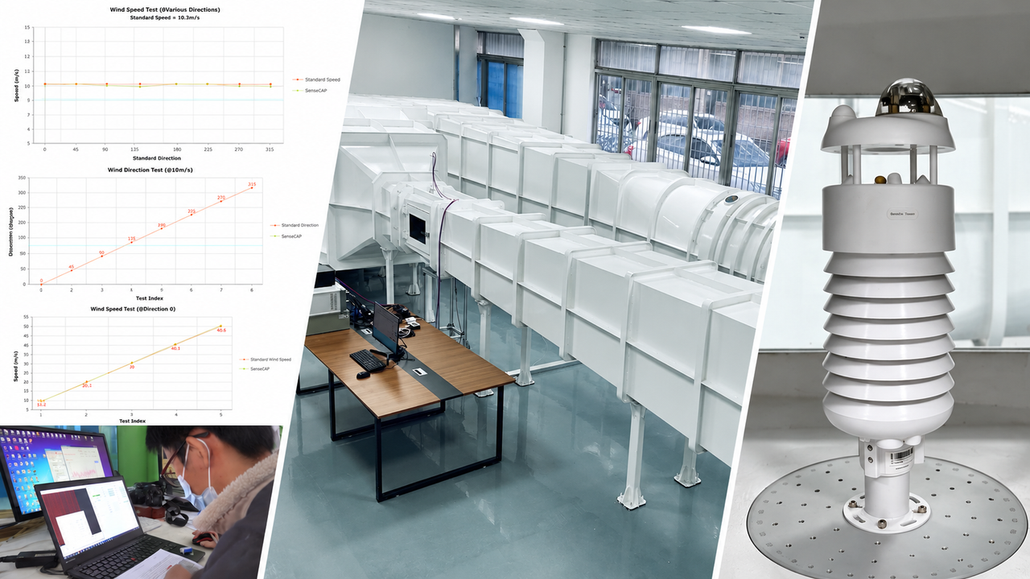
To collect these local observations, buoy monitoring systems can integrate the SenseCAP weather station series. The series uses ultrasonic technology to measure wind speed and direction. It calculates wind conditions by comparing sound travel times downwind and upwind, without rotating cups or a mechanical vane. This design reduces mechanical friction, wear, and jamming, helping lower maintenance needs at observation points on the water. Ultrasonic Wind Measurement Principles and Benefits To verify measurement performance, Seeed Studio also tests and calibrates its sensors in its in-house wind tunnel laboratory. Sensor readings are compared with known reference wind speeds and directions to check accuracy and consistency. Official SenseCAP Wind Tunnel Testing Overview With suitable buoy mounting, data collection, and communication equipment, these observations can be shared with shore-based managers and field teams to support daily operations.
How Rainfall Monitoring Helps Keep Water Operations on Track
Rainfall also affects operations on the water. Heavy rain may reduce visibility, making buoys and nearby objects harder to identify. It can also affect outdoor sampling, equipment maintenance, and instrument handling. Beyond total rainfall, rainfall intensity also matters. In a hypothetical comparison, 5 mm of rain over one hour produces an average intensity of 5 mm/h. If the same amount falls within five minutes, the average intensity reaches 60 mm/h—12 times as high. Products in the SenseCAP weather station series that support radar rainfall monitoring use electromagnetic wave scattering analysis to measure rainfall intensity. They require no collection funnel or mechanical tipping mechanism, reducing maintenance associated with blocked collection openings and moving-part wear. SenseCAP Radar Rainfall Technology This helps reduce maintenance needs at buoy observation points that require boat access. With suitable installation, data collection, and communication equipment, rainfall records can be reviewed alongside wind speed and direction. Combined with visibility information, weather forecasts, and task requirements, these observations support departure planning and adjustments to work on site.
Professional Weather Monitoring for Reliable Operations on the Water
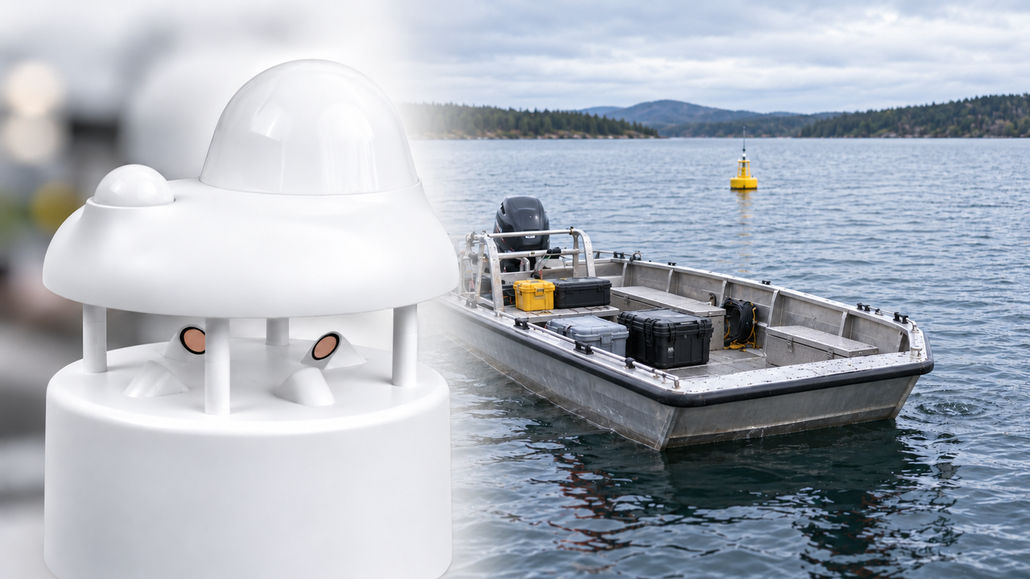
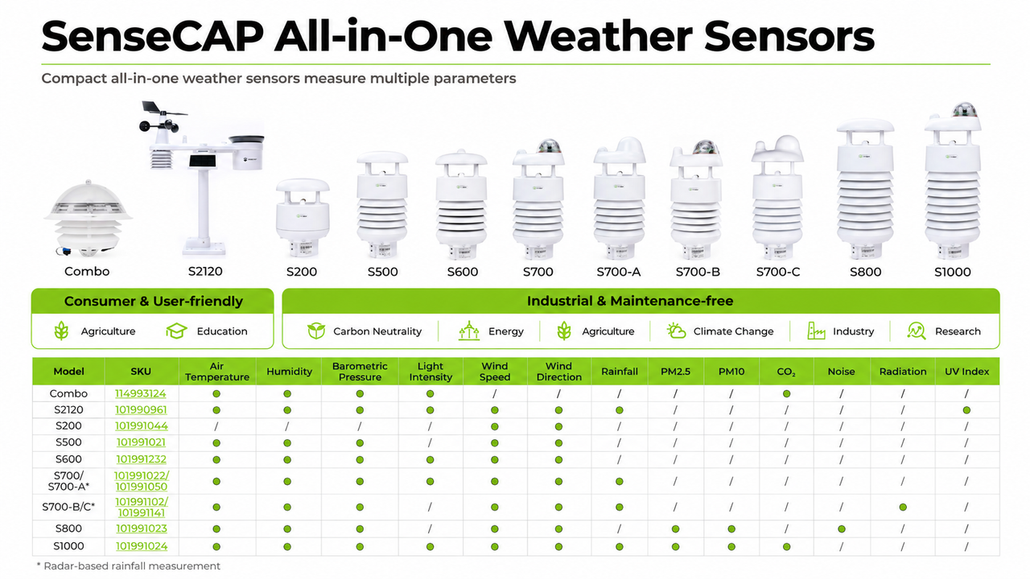
Accurate and reliable weather monitoring depends on advanced sensing technology and professional equipment performance. The SenseCAP weather station series uses ultrasonic technology to measure wind speed and direction, while selected models also feature non-contact radar rainfall monitoring. These technologies provide precise measurements of local wind conditions and rainfall. For example, the SenseCAP S700-A offers wind speed accuracy of ±0.3 m/s at speeds up to 10 m/s, wind direction accuracy of ±3°, and radar rainfall measurement accuracy of ±10%. Unlike traditional mechanical sensors, its design requires no rotating wind sensors or mechanical tipping buckets. This helps reduce mechanical wear, blockage, and maintenance needs, especially at buoy monitoring sites that are difficult to access. In addition, Seeed Studio conducts professional wind tunnel testing and calibration, along with strict quality control, to ensure measurement accuracy and consistency. SenseCAP weather stations feature industrial-grade designs, with selected models offering IP66 protection for demanding outdoor environments. When integrated into buoy monitoring systems, SenseCAP provides continuous and reliable local weather data. This helps operators make informed decisions about inspections, sampling, and equipment maintenance. Explore the SenseCAP professional weather station series to build a smarter, more efficient, and more reliable weather monitoring solution for your operations on the water.
About Author
