From Experience to Evidence: How Growers in Ningxia Use SenseCAP Sensors to Help Prevent Cherry Tomato Cracking
By violet 53 minutes agoFrom a real-world deployment in Ningxia, see how 18 SenseCAP sensors and daily AI reports helped growing teams monitor greenhouse conditions, identify cherry tomato cracking risks earlier, and turn environmental observations into practical growing decisions.
Across two growing areas, 18 sensing devices helped turn 40 days of environmental observations into daily risk assessments and practical growing decisions.
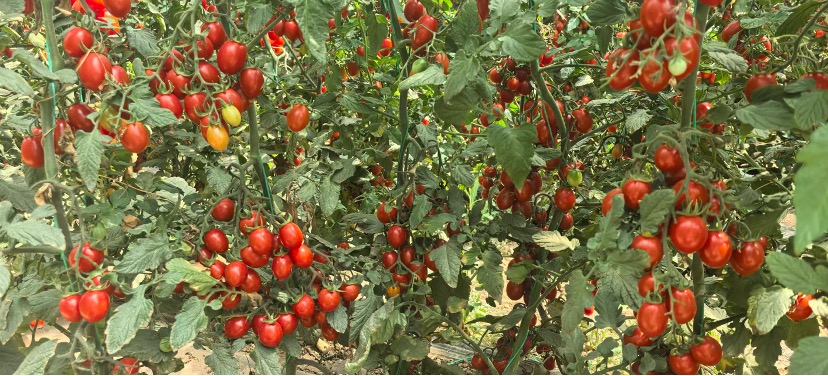
In protected cultivation, few quality problems are as frustrating as cherry tomato cracking.
A run of overcast, rainy days followed by sudden sunshine can quickly turn a promising harvest into a sorting challenge. Why did the fruit crack? Which greenhouse is most at risk? What should the team do tomorrow?
Traditionally, the answers depended heavily on experienced growers walking through the greenhouses—watching the weather, feeling the fruit, and checking the soil underfoot. That expertise was valuable, but much of it remained in people’s heads: difficult to document, share, or turn into an early warning.
During the first harvest season of 2026, the Haifan project covered approximately 500 mu, or 33 hectares, across Zhongning and Haiyuan in Ningxia, China. At these sites, environmental monitoring became part of the growing teams’ daily efforts to anticipate cracking risks and take preventive action.
The project combined Seeed Studio’s SenseCAP Combo 4G Environmental Sensor and SenseCAP S700-C 7-in-1 Compact Weather Station with radar rainfall sensing (used with SenseCAP Senor Hub 4G Data Logger). An AI agent platform called OpenClaw analyzed the environmental observations and supported daily risk assessments.
Together, the sensors and platform helped the teams move from reviewing cracking after it occurred toward identifying risks and planning preventive action before the next harvest.
What did the system reveal over those 40 days? And how did those observations change everyday decisions in the greenhouse?
1. A Digital Nervous System in the Field
This was not simply a matter of buying a few sensors and hanging them in greenhouses.
The project established a connected workflow: sensing => analysis => action, supported by continuous environmental observations.
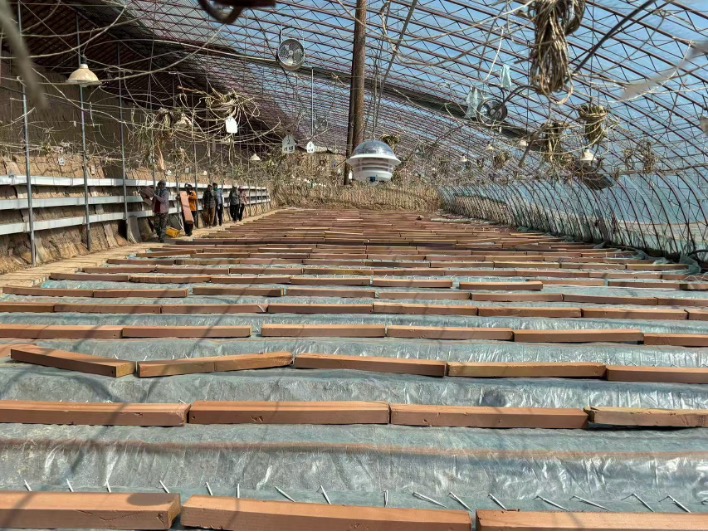
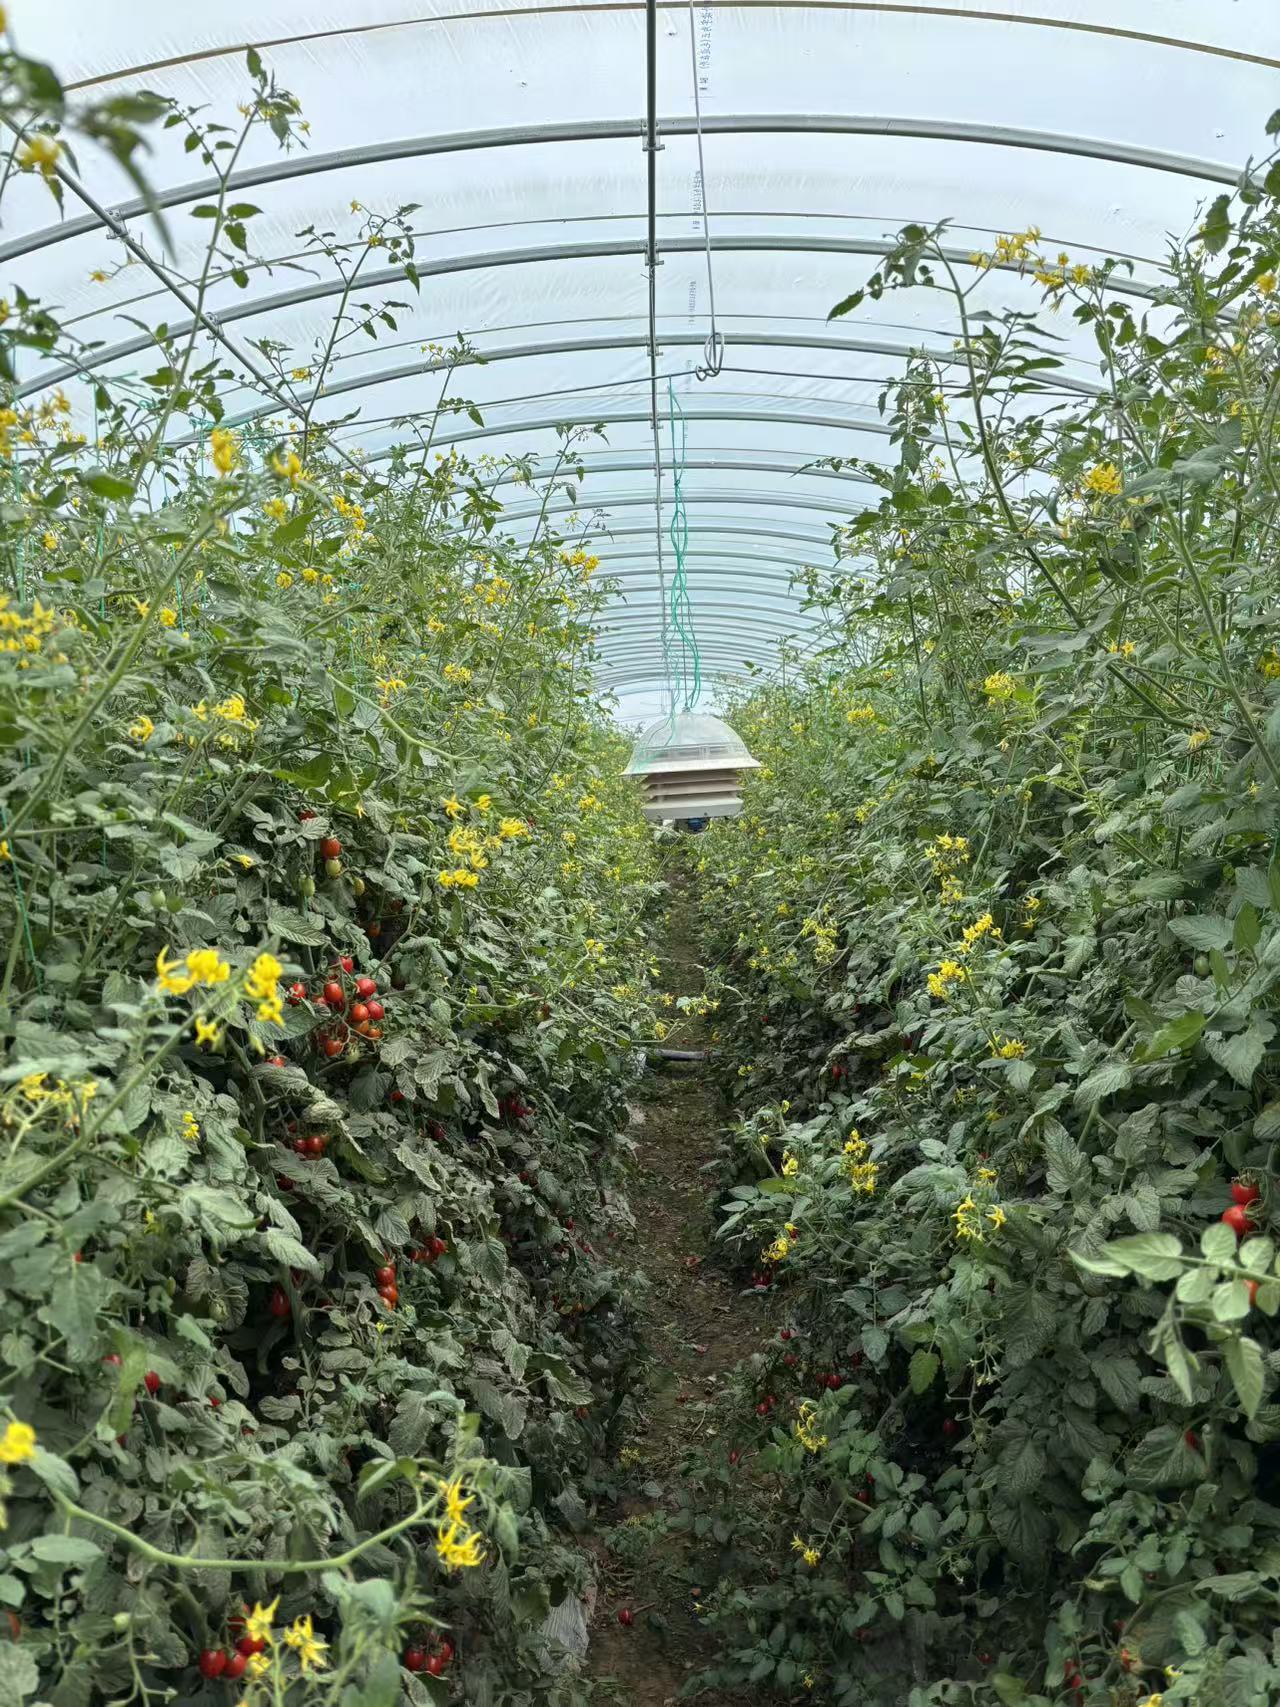
Across the two growing areas, 18 SenseCAP sensing devices were deployed in a range of structures, including high-arched plastic houses, normal-arched houses, old houses without ventilation openings, and multi-span greenhouses across multiple sites including Gaiwan, Luoshan, Gaotai etc..
Quick notes (4 types of environments)
-
- High-arched plastic greenhouse
- Normal-arched plastic greenhouses
- Old Greenhouse: no ventilation openings
- Multi-span greenhouses
The monitoring network covered four groups of measurements:
-
-
Air temperature, relative humidity, and dew point: Tracking changes in the greenhouse atmosphere and conditions associated with condensation risk.
-
Soil temperature and moisture: Monitoring temperature and volumetric water content around the roots.
-
Light: Recording illuminance or photosynthetic photon flux density (PPFD), depending on the sensing channel.
-
Outdoor weather: Providing context through wind speed, barometric pressure, and rainfall observations.
-
Over 40 days, 35 sensing channels automatically recorded 25,152 IoT environmental records. The project also reported 1,542 triggered and linked events.
Together, the devices formed a digital nervous system across the growing areas. Changes in temperature, light, water, and humidity became a continuous stream of objective observations – giving the AI agent platform a traceable foundation for analysis.
2. Making Hidden Risks Visible: Four Firsts for the Growing Team
Continuous data from the SenseCAP sensors allowed the platform to calculate indicators such as vapor pressure deficit, or VPD, and send assessment reports directly to the team’s WeChat group each morning.
What Is VPD, and Why Does It Matter?
VPD is the difference between the water vapor pressure at saturation and the actual water vapor pressure in the air. Usually expressed in kilopascals (kPa), it combines temperature and humidity into an indicator of the atmosphere’s drying demand.
A low VPD indicates air close to saturation; a higher VPD indicates greater drying demand. For growers, it helps explain conditions affecting transpiration and plant water balance that relative humidity alone may not fully describe.
In this project, those measurements gave the team a new way to investigate long-debated growing problems.
1st - Putting Numbers Behind the Ventilation Question
On August 19, the project recorded a cracking rate of 0.3% in a greenhouse with upper ventilation openings, compared with 6.3% in one without them, which showed a 21-fold difference.
The team interpreted the environmental records as evidence that ventilation design was a major contributor to the difference, strengthening the case for ventilation upgrades.
This changed the discussion. Improvements could now be considered alongside recorded differences in greenhouse conditions and fruit quality, rather than relying on experience alone.
2nd - Capturing the Season’s Most Extreme Day–Night Swing
On August 24, the system recorded a daytime VPD peak of 2.05 kPa and a nighttime minimum of 0.01 kPa in the Luoshan old greenhouse, which lacked ventilation openings.
The continuous record captured a greenhouse environment moving from strong daytime drying demand to near-saturated nighttime conditions. It helped the technical team understand a pattern that had previously been difficult to document—and connect it with the cracking observed afterward.
Rather than relying on a single daytime inspection, the team could now see what the crop experienced across the full day and night.
3rd - Flagging Prolonged High Humidity Before the Next Harvest
During the night of August 24, Liutao Greenhouse 9-2 experienced relative humidity above 97.8% for 11 hours, with VPD falling to 0.04 kPa.
The system flagged the prolonged high-humidity exposure before the next picking round. The following day, the team recorded a clear increase in cracking.
The warning gave the quality-control team time to adjust the picking schedule and sorting criteria in advance, helping limit avoidable losses.
The practical value was not simply knowing that the greenhouse had been humid. It was knowing how humid it had been, for how long, and what needed attention next.
4th - Testing Assumptions About Irrigation and Cracking
In the new greenhouse at Liutao, soil water content was recorded at 17–18%, compared with 14–15% in the Zhongning open-field area. Cracking was also more severe in the Liutao greenhouse.
Viewed alongside the air temperature and humidity records, these observations led the growing team to question whether soil moisture alone could explain the pattern.
After reviewing the soil readings alongside the air temperature and humidity records, the project team concluded that atmospheric fluctuations were an important contributor in this case and revised its irrigation and ventilation strategies accordingly.
The lesson was not that root-zone water supply no longer mattered. It was that cracking risk could not be understood from a soil-moisture reading in isolation.
3. From Dashboards to WeChat: Bringing Data into the Daily Routine
Technology becomes useful when it fits the way people actually work.
For the frontline team, the most visible change was not another dashboard. It was receiving a clear assessment before the morning greenhouse rounds.
For the Site Manager: Knowing Where to Go First
“We used to keep track of which greenhouse was humid or hot in our heads while making the rounds. Now the WeChat report arrives every morning. Before heading out, we already know the condition of each greenhouse and which area needs attention first.”
For the Growing Team: A Shared Basis for Decisions
The environmental trend curves gave the technical team a shared basis for discussing conditions in the older greenhouses. Rather than debating why cracking kept recurring, they could examine a continuous record and prioritize ventilation improvements.
For Quality Control: Time to Adjust Before Picking
“During those overcast, rainy days, high humidity lasted more than 16 hours a day. The report flagged the risk a day ahead, so we adjusted our sorting criteria in advance. Losses were noticeably lower than during the same period last year.”
Each morning, the growing team received a tailored WeChat report covering:
Weather comparisons.
Key findings.
A risk matrix.
Recommendations for the following day’s field operations.
Those recommendations were specific enough to act on—for example, opening ventilation before 10:00 a.m. or prioritizing checks for cracking around the fruit shoulders.
Experienced judgment was not removed from the process. It was translated into a repeatable digital workflow that more people could follow.
From Environmental Records to Everyday Prevention
18 SenseCAP devices.
25,152 environmental records.
1,542 linked events.
40 days of continuous monitoring.
In this project, the SenseCAP Combo 4G Environmental Sensor and the wider monitoring network became more than instruments installed in a greenhouse. They became the growing areas’ digital nervous system.
Instead of asking only why fruit had cracked, the team could investigate when and where cracking occurred, and what environmental conditions preceded it.
That created a three-part evidence trail: time, location, and environment.
The team could assess cracking risks earlier, trace the conditions preceding an incident, and make preventive measures part of a repeatable daily workflow—not simply explain the damage after harvest.
The shift was not from experience to automation. It was from experience alone to experience supported by evidence.
Explore Further
Managing a greenhouse where humidity, temperature, and irrigation interact in complex ways? A useful starting point is to identify which conditions you need to measure—and how those observations can fit into your team’s existing routine.
Explore the SenseCAP sensor catalog, or contact [email protected] to discuss the monitoring requirements of your growing environment.
Note: This English version is adapted from its the original Chinese article: Zhiyuan Haifan — A Case Study in Intelligent Environmental Monitoring for Protected Agriculture.
Read More from the Sensor Know-How Series
- Solar Radiation Sensors Explained: Thermopile vs. Photodiode
- Why Temperature Sensors Need a Solar Radiation Shield for Accurate Measurements
- Two Technologies for Wind Monitoring: Cup-and-Vane vs. Ultrasonic Sensors
- NDIR CO2 Sensor Explained: How Infrared Gas Sensing Works
- Doppler Radar Precipitation Sensor: How Can It Measure Rain Without a Funnel?
- 2026 Climate Reality Check: When Extremes Become the Norm, How Do We Adapt?
- Giving Soil a “CT Scan”: Soil Moisture Sensors Explained
About Author
